Bitcoin Bull Run History: A Visual Journey Through Price Surges
Bitcoin’s price history is characterized by dramatic cycles of bull runs and bear markets. Understanding these past surges provides valuable context for navigating the volatile cryptocurrency landscape. Analyzing the historical charts reveals patterns and potential drivers behind these explosive growth periods.
Early Days & The 2011 Surge
Bitcoin’s first significant bull run occurred in 2011. Emerging from near obscurity, the price leaped from fractions of a dollar to over $30 in a matter of months. This rally was fueled by increasing awareness and early adoption among tech enthusiasts and libertarians. However, this initial bubble quickly burst, leading to a steep correction. The chart illustrates a dramatic spike followed by a painful retracement, a pattern that would become familiar.
The 2013 Boom & Bust
2013 witnessed two distinct bull runs. The first, in the spring, saw the price climb to over $260, driven by increased media attention and Cyprus’s financial crisis, which led some to view Bitcoin as a safe haven. The second, later in the year, propelled Bitcoin to its then all-time high of over $1,100. This surge was partly attributed to growing interest from China. Again, the rapid price increase was followed by a severe correction, plunging the price back down to the hundreds.
The 2017 Mania
The 2017 bull run is perhaps the most well-known. Bitcoin’s price exploded from under $1,000 at the start of the year to nearly $20,000 by December. This phenomenal growth was fueled by a combination of factors: mainstream media coverage, increased institutional interest, and the proliferation of initial coin offerings (ICOs) which indirectly benefited Bitcoin by driving demand for cryptocurrencies generally. The chart shows an almost vertical ascent, culminating in a sharp decline throughout 2018, ushering in the “crypto winter.”
The 2020-2021 Rally
Following a period of consolidation, Bitcoin embarked on another significant bull run in late 2020 and continued throughout 2021. This rally differed from previous ones in that it was largely driven by institutional adoption. Companies like MicroStrategy and Tesla invested heavily in Bitcoin, legitimizing it as a store of value. Furthermore, increasing regulatory clarity and the launch of Bitcoin futures ETFs fueled further demand. The price reached a new all-time high of nearly $69,000. Again, the chart shows a significant climb, although perhaps less parabolic than the 2017 surge.
Analyzing the Charts: Common Threads
Examining these historical charts reveals several recurring themes. Bull runs are often preceded by periods of relative stability and consolidation. They are typically triggered by a catalyst, such as increased institutional adoption, positive regulatory developments, or a surge in media attention. However, these rallies are often unsustainable and followed by significant corrections. The charts highlight the importance of understanding market cycles and managing risk when investing in Bitcoin.
 1306×775 bitcoin bull cycle pattern bncblx from www.tradingview.com
  1249×681 bitcoin tendency differences today from elitecurrensea.com
  474×201 bull run historic data bitcoin suggests from www.tradingview.com
  2868×1654 bitcoin bull run bear market weekly chart june bitstamp from www.tradingview.com
  2662×1700 bull run bitcoin time from www.tradingview.com
  1577×887 bitcoin started bull cycle bitstampbtcusd excavo from www.tradingview.com
  474×340 bitcoin halving bull run cycle from medium.com
  474×328 bitcoin historic chart suggests bull run starting from cryptopotato.com
 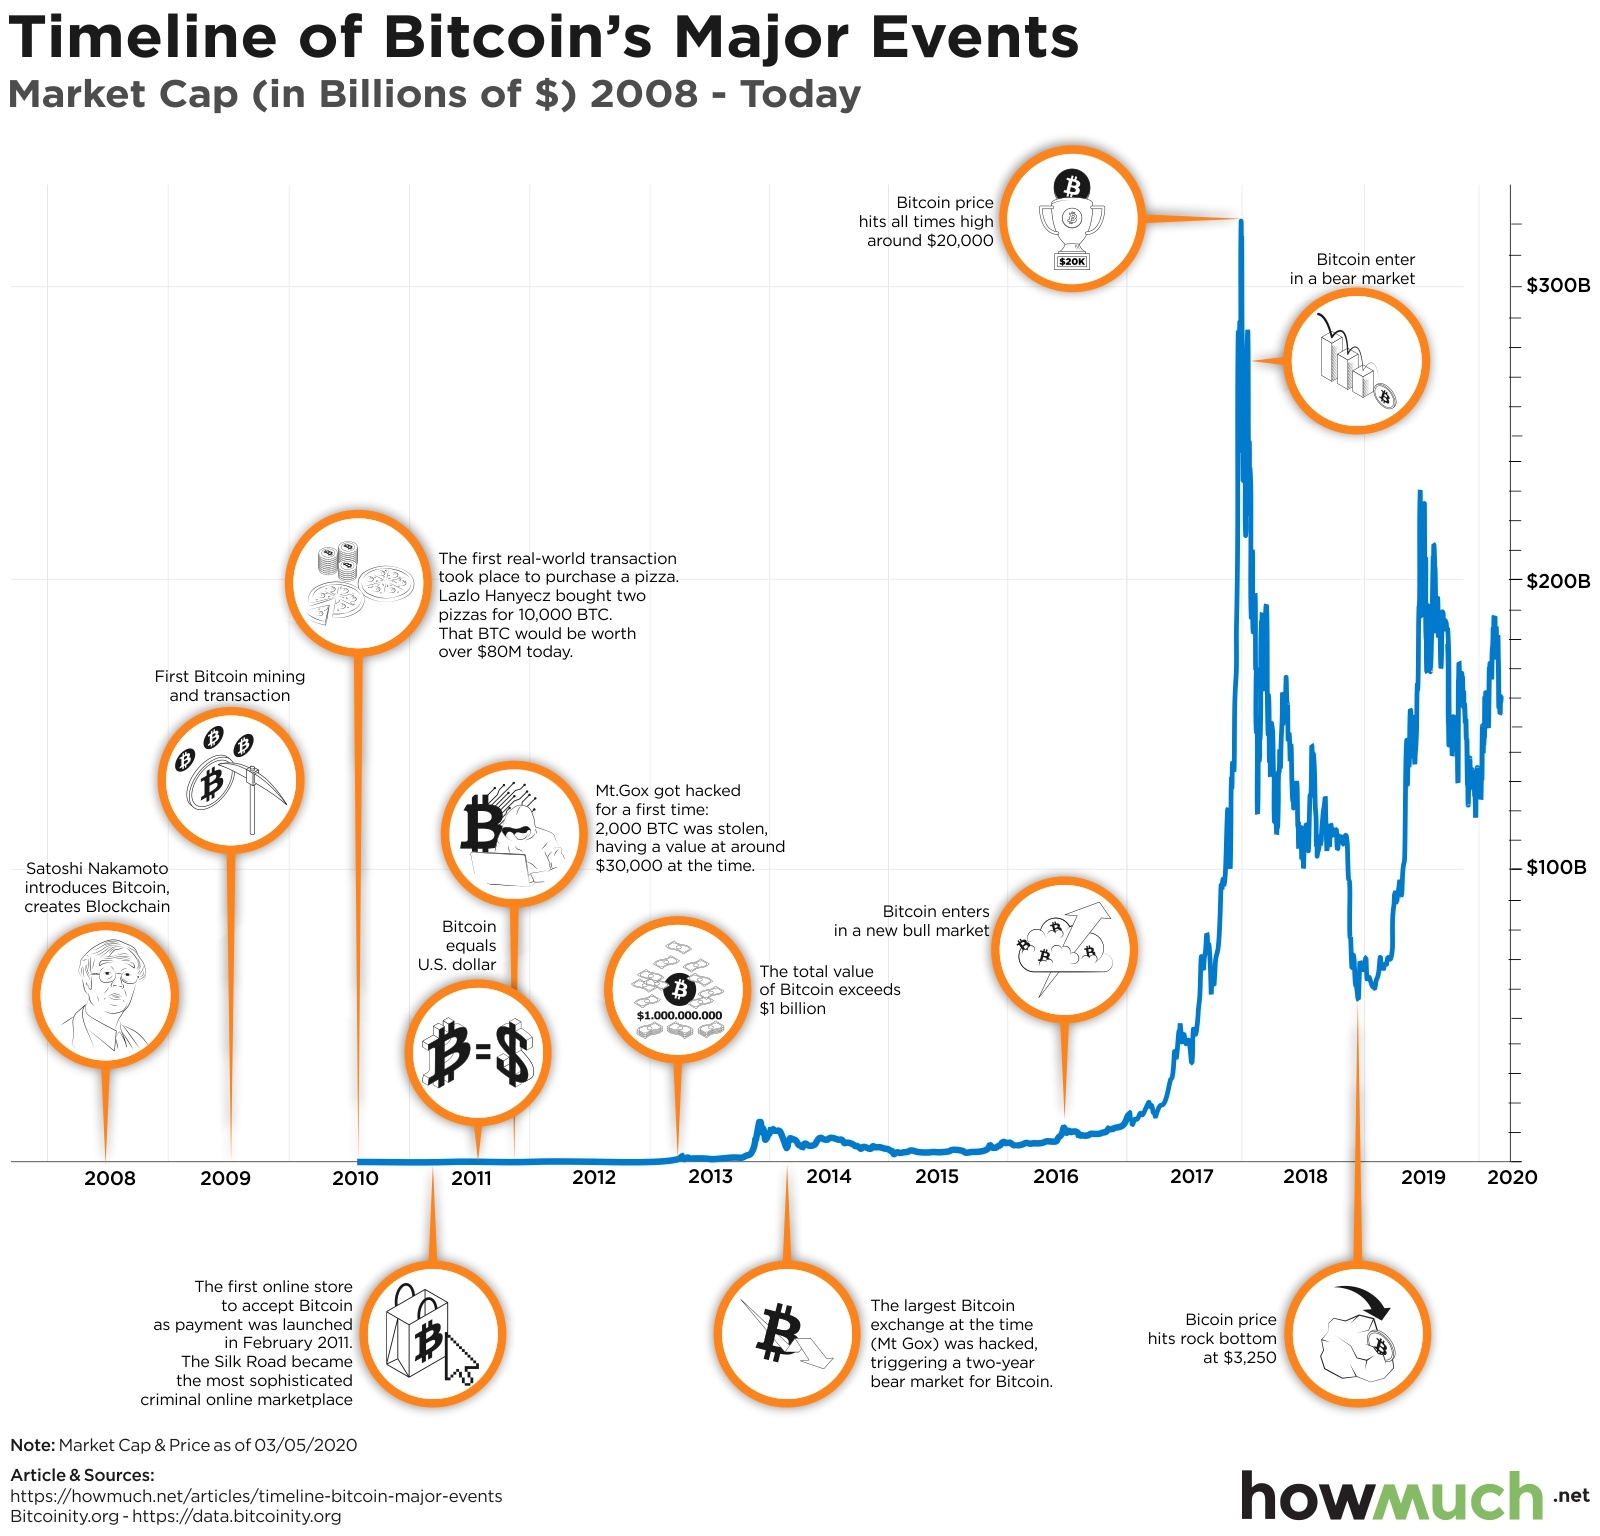 1600×1536 visualizing bitcoins wild ride decade from howmuch.net
  1200×693 bull run looked compared from cryptocurrencyfacts.com
  1546×816 bitcoin year cycle bull run bitstampbtcusd from www.tradingview.com
  1913×983 bitcoin chart analysis bulls return prices edge higher nasdaq from www.nasdaq.com
  885×804 top traders bitcoin log chart points style btc bull run from cointelegraph.com
  2560×1400 bitcoin trend analysis cycles percent gains money hans from money.hansmast.com
  1456×874 analysis current bitcoin bullish cycle from www.bitcoininsider.org
  1452×752 bitcoin timing top current bull cycle bncblx from www.tradingview.com