Bitcoin Bull Run Tracker: Gauging the Momentum
The Bitcoin bull run, a period of sustained and significant price increases, is a topic of constant speculation and analysis in the cryptocurrency community. Predicting the start, duration, and peak of a bull run is notoriously difficult, but several key indicators and tracking methods are used to gauge the potential momentum of the market.
Key Indicators for Tracking a Bitcoin Bull Run:
- Price Action and Trendlines: The most basic indicator is the price itself. A sustained uptrend, breaking through previous resistance levels, and forming higher highs and higher lows are hallmarks of a bull run. Technical analysts draw trendlines to identify and monitor these price patterns. A break *above* a long-term downtrend line can signal the potential start of a bull market.
- Moving Averages: Simple Moving Averages (SMAs) and Exponential Moving Averages (EMAs) help smooth out price fluctuations and identify the underlying trend. Common SMA combinations, such as the 50-day and 200-day moving averages, are closely watched. A “golden cross,” where the 50-day SMA crosses above the 200-day SMA, is often interpreted as a bullish signal.
- On-Chain Data: Analyzing data directly from the Bitcoin blockchain provides insights into investor behavior and network activity. Metrics like active addresses, transaction volume, and the number of new wallets can indicate growing adoption and demand. A decrease in Bitcoin held on exchanges often suggests long-term holding (HODLing) sentiment.
- Bitcoin Dominance: The Bitcoin dominance metric reflects Bitcoin’s market capitalization relative to the total cryptocurrency market cap. A rising Bitcoin dominance during a bull run can suggest that Bitcoin is leading the rally, attracting capital from altcoins.
- Fear and Greed Index: This index measures market sentiment on a scale from 0 to 100. Extreme greed (high values) can indicate a market top, while extreme fear (low values) might suggest a buying opportunity. The index should be used with caution, as it can be a lagging indicator.
- Halving Cycles: Historically, Bitcoin bull runs have often followed the Bitcoin halving, an event that occurs approximately every four years, reducing the block reward given to miners. The reduced supply typically puts upward pressure on the price. The market often anticipates and reacts to halvings well in advance.
- Macroeconomic Factors: Global economic conditions, such as inflation, interest rates, and geopolitical events, can significantly influence Bitcoin’s price. For example, a weakening dollar or rising inflation might lead investors to seek alternative stores of value like Bitcoin.
- Institutional Adoption: Increased participation from institutional investors, such as hedge funds, corporations, and pension funds, is a crucial driver of bull runs. Tracking institutional inflows, adoption of Bitcoin as a treasury asset, and regulatory developments surrounding Bitcoin can provide insights into institutional sentiment.
Tools for Tracking a Bull Run:
Various websites and platforms provide tools and data for tracking these indicators. Popular resources include:
- TradingView: Offers charting tools and technical analysis indicators.
- Glassnode: Provides on-chain data and analytics.
- CoinMarketCap & CoinGecko: Track price, market capitalization, and Bitcoin dominance.
- Alternative.me: Displays the Fear and Greed Index.
Conclusion:
Tracking a Bitcoin bull run involves monitoring a combination of technical indicators, on-chain data, market sentiment, and macroeconomic factors. No single indicator is foolproof, and it’s crucial to consider the overall context of the market. By staying informed and using a variety of tools, investors can better understand the potential momentum of the Bitcoin market and make more informed decisions. However, remember that cryptocurrency investing is inherently risky, and past performance is not indicative of future results.
 1920×1080 bitcoin bull run from blog.bitpanda.com
  1024×419 bitcoin bullrun cest le moment pour une phase haussiere from www.cointribune.com
  1792×1024 bitcoin average cycle count suggests bull run months from bitcoinist.com
  474×331 charts show bitcoin bull run isnt stopping from coingape.com
  1792×1024 bitcoin btc historical data signals october bull run kickoff from bitcoinist.com
  1920×1080 como aprovechar al maximo este bull run de bitcoin otras criptomonedas from www.criptonoticias.com
  474×266 bitcoin bull run understanding phenomenon impact from theblock101.com
  1200×675 el bull run de bitcoin ha comenzado asi es como puedes sacarle el from www.criptonoticias.com
  1669×967 explained bitcoin halving nex crypto bull run from fintelegram.com
  1124×732 bitcoin btc ripple xrp set dominate bull run from cryptodaily.co.uk
  1470×856 historical data bull run btc ltc peak from www.reddit.com
  1600×1543 bitcoin sets stage bull run heres from finbold.com
  474×263 understanding bitcoins bull run bitcoin predictions moralis from moralismoney.com
  2000×984 bitcoin btc parallelen zum bullrun from bitcoin-2go.de
  1500×857 bitcoin bull run turbo kurs laut prognose viel schneller als from www.ftd.de
  1400×800 bitcoins bull run impact crypto market health eu from www.eubusinessnews.com
 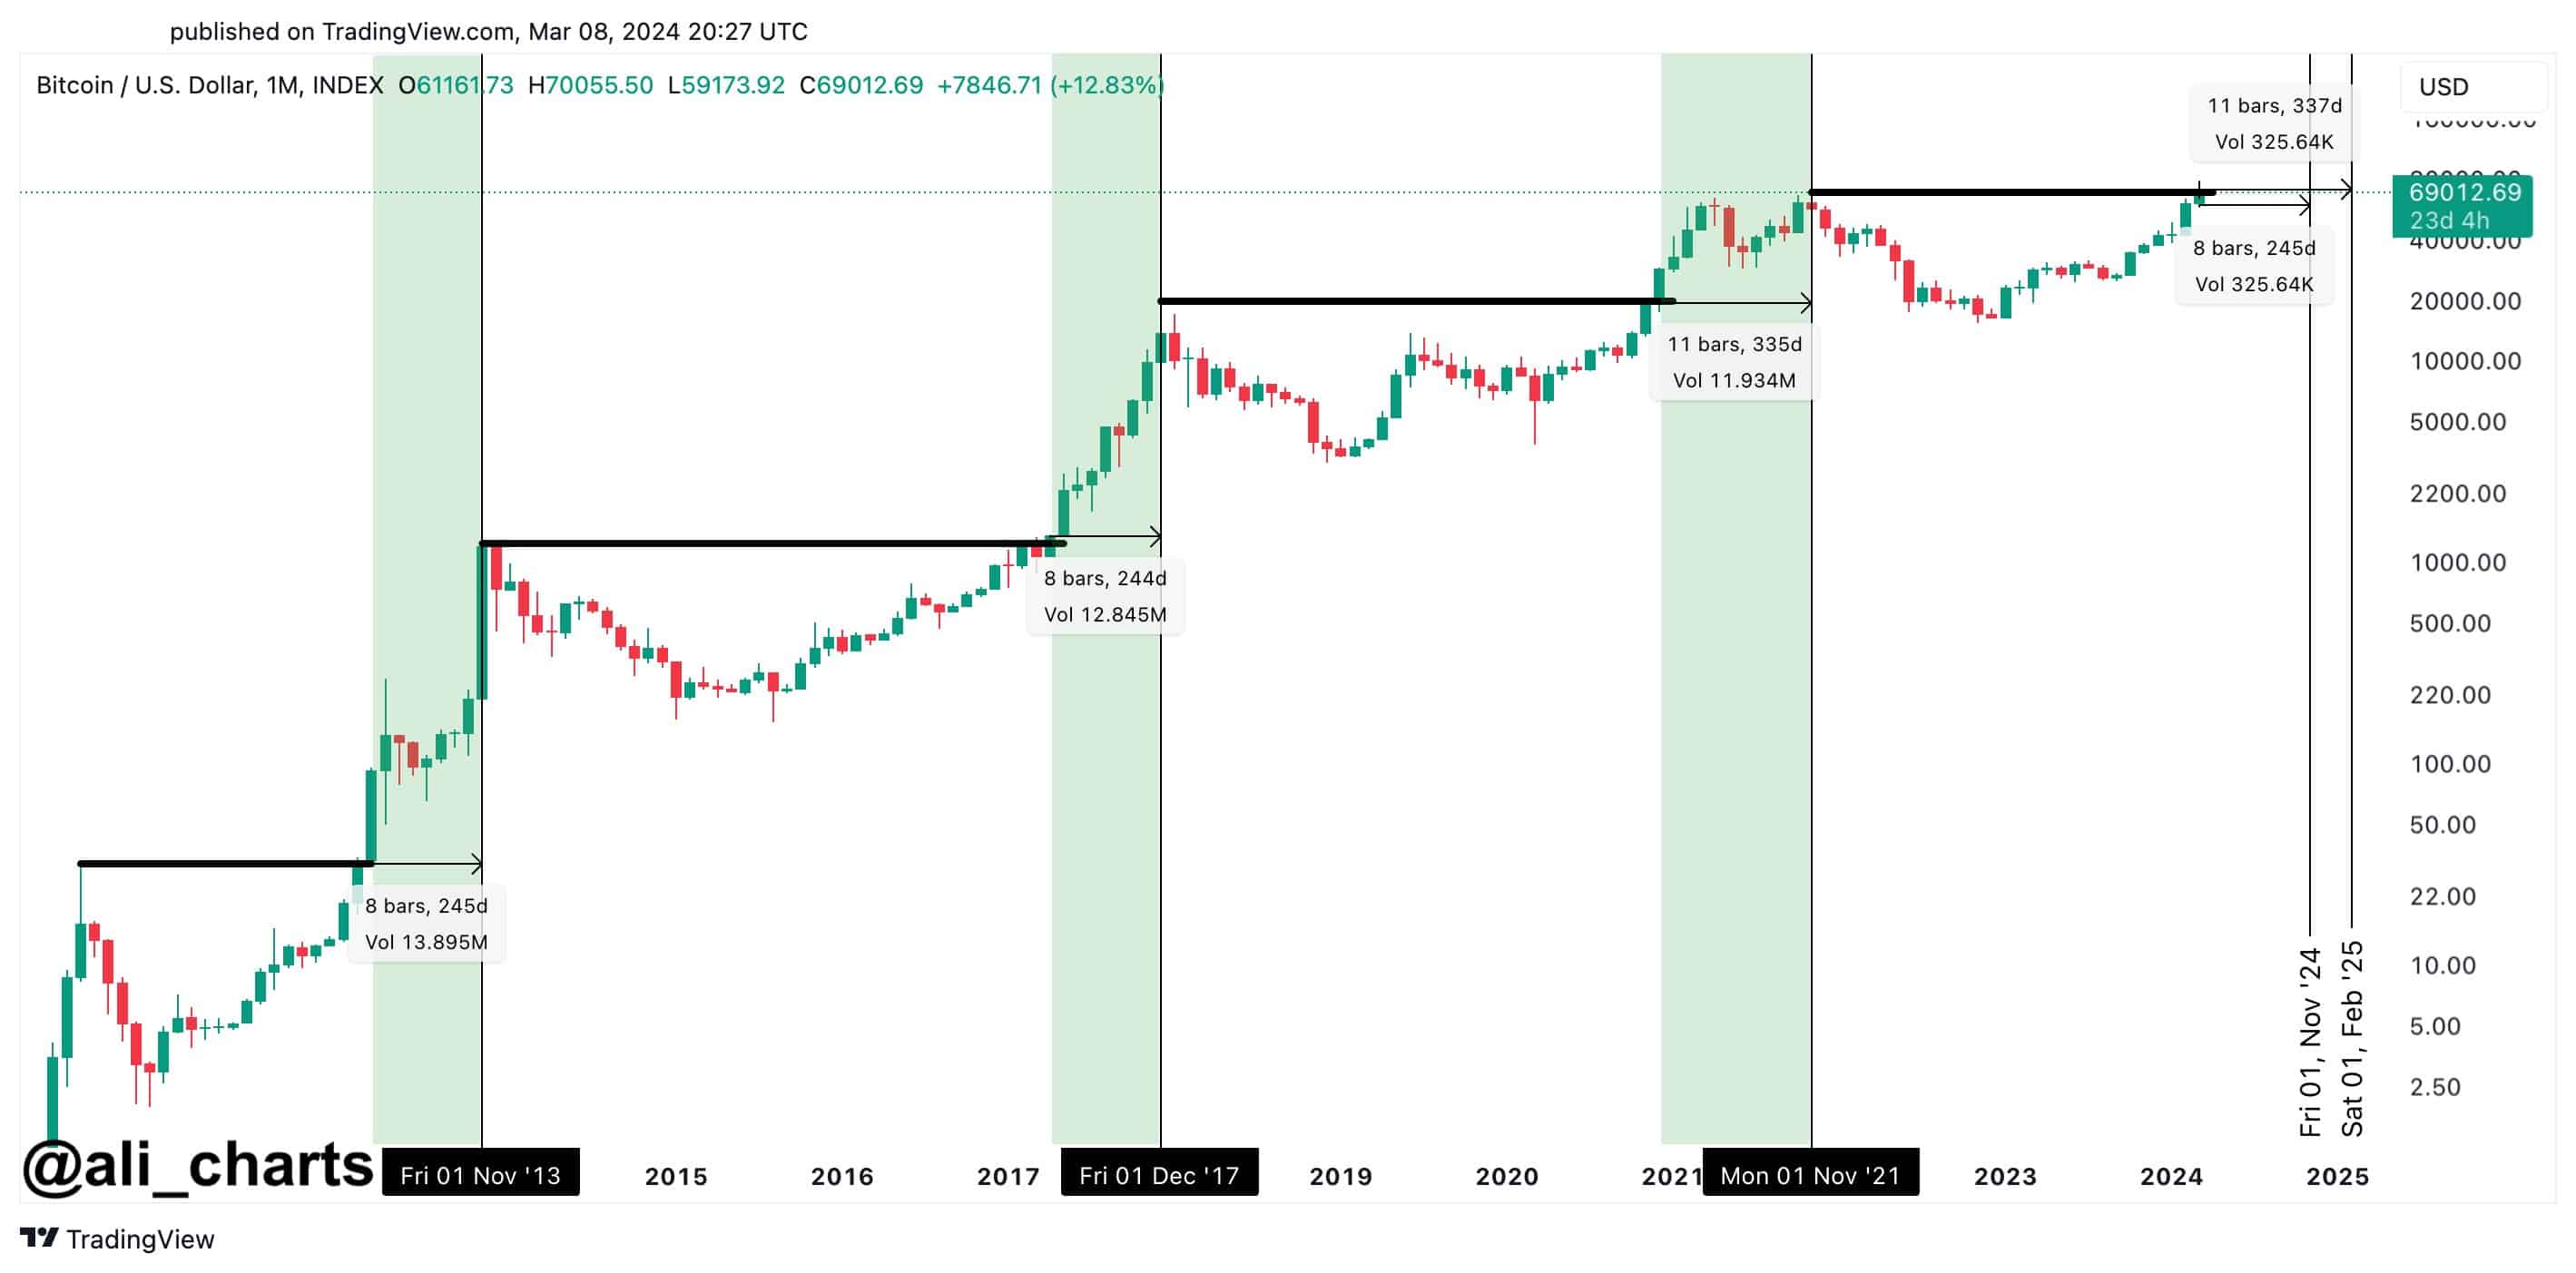 2838×1403 bitcoin btc price bull run continue november from coingape.com
  1200×630 bitcoins present bull run extraordinary compared from blockchain.news
  1044×546 crypto bull run accelerates ethereum binance coin bnb retest from coinpedia.org
  1200×628 bitcoin price analysis heres timeline bitcoin bull run from coinpedia.org
  1200×699 ya comenzo el bull run de bitcoin la comunidad opina from www.criptonoticias.com
  1280×720 bitcoin bull run bitcoin btc youtube from www.youtube.com
  3104×1416 el bitcoin bull run ya esta aqui como puede beneficiarse de el from b2binpay.com
  1280×720 bitcoin btc truth bull run from www.youtube.com
  800×450 bitcoin btc rsi level shows early bull run from www.bitcoininsider.org
  1980×1170 crypto bull run history rise bitcoin altcoins techopedia from www.techopedia.com
  1080×1080 bitcoin bull run exploring intriguing phenomenon crypto from nurp.com
  1280×720 bitcoin bull run started dont breakout coin bitcoin from www.youtube.com
  1024×585 bitcoin bullrun index cbbi analyse und vorhersage investment garage from investmentgarage.de
  996×663 prepare crypto bull run from blog.cwallet.com
  2662×1700 crypto bull run understanding eth hype ethereum from kawaii-as-lucifer.blogspot.com
  1800×1013 crypto bull run history fremveksten av bitcoin og altcoins from www.techopedia.com
  900×536 historical bitcoin cycles hint charging btc bull run from www.reddit.com
  1200×693 bull run looked compared from cryptocurrencyfacts.com