A crypto market bull run chart is a visual representation of a sustained period of increasing prices across various cryptocurrencies. It signifies a strong and optimistic market sentiment, fueled by factors like increased adoption, positive news, technological advancements, or broader economic trends. Understanding the patterns and characteristics of these charts is crucial for anyone navigating the crypto landscape.
The chart typically displays a consistent upward trend, often characterized by a series of higher highs and higher lows. Each peak in the chart represents a new all-time high (ATH) for the specific cryptocurrency or the overall market capitalization. The steeper the upward slope, the faster and more intense the bull run.
Several phases are usually observed during a bull run: Accumulation, Early Uptrend, Mania, and Distribution.
- Accumulation: This initial phase is characterized by a relatively flat or slightly upward-trending price action. “Smart money” or informed investors start accumulating the cryptocurrency, often before mainstream awareness. Volume may be low, and the market remains relatively unnoticed.
- Early Uptrend: As the price starts to climb steadily, more investors begin to notice the positive momentum. News or developments surrounding the cryptocurrency may start attracting attention. Volume typically increases as the uptrend gains traction.
- Mania: This is the most exciting and often the most dangerous phase. FOMO (Fear Of Missing Out) drives exponential price growth. Mainstream media coverage intensifies, attracting a surge of new investors, many of whom lack deep understanding of the underlying technology or risks. Volume peaks, and speculative trading reaches fever pitch. This phase is often unsustainable.
- Distribution: As the bull run matures, early investors who accumulated during the initial phase begin to take profits. This leads to increased selling pressure, which may cause price volatility. The market begins to correct, and the upward trend starts to weaken. This phase can be difficult to identify in real-time, as dips may initially be perceived as buying opportunities.
Identifying a bull run chart requires analyzing various indicators, including:
- Price Action: Look for a consistent pattern of higher highs and higher lows.
- Volume: Increasing volume typically confirms the strength of the uptrend.
- Moving Averages: The price trading consistently above moving averages (e.g., 50-day, 200-day) is a bullish signal.
- Relative Strength Index (RSI): While RSI can indicate overbought conditions during the mania phase, it’s essential to consider the overall trend. During a strong bull run, RSI can remain in overbought territory for extended periods.
- Market Sentiment: Positive news, increased adoption, and growing social media engagement can fuel a bull run.
It’s crucial to remember that past performance is not indicative of future results. Crypto markets are highly volatile and unpredictable. Bull runs inevitably come to an end, often followed by significant price corrections or bear markets. Investors should exercise caution, conduct thorough research, and manage their risk accordingly. Diversifying your portfolio and understanding your risk tolerance are essential strategies for navigating the crypto market, especially during periods of rapid price appreciation.
 2868×1654 bitcoin bull run bear market weekly chart june bitstamp from www.tradingview.com
  474×340 bitcoin halving bull run cycle from medium.com
  1472×888 crypto bull run date cryptocurrency bull from wegogorasputin.blogspot.com
  474×285 factors confirm crypto bull market officially begun from www.newsbtc.com
 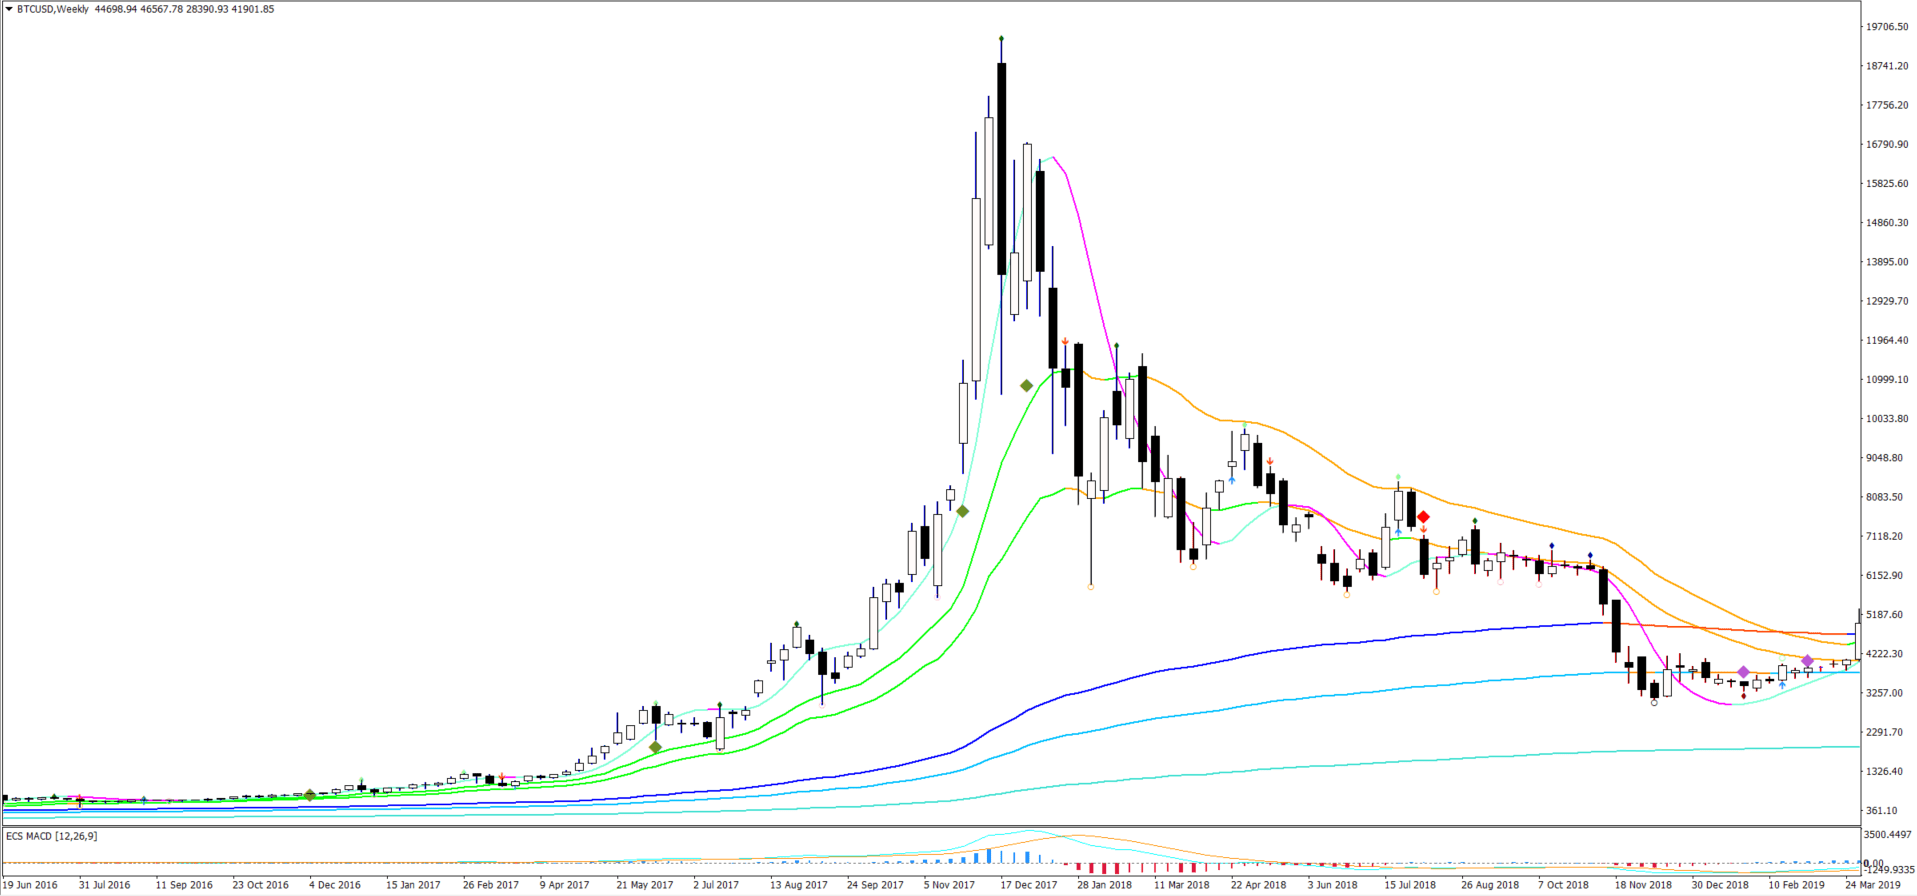 1917×896 bitcoin tendency differences today from elitecurrensea.com