Bitcoin Bull Run History: A Timeline
Bitcoin, the pioneering cryptocurrency, has experienced several dramatic bull runs throughout its history. These periods are characterized by rapid and sustained price increases, often fueled by a combination of factors like increased adoption, technological advancements, and macroeconomic trends. Here’s a timeline of notable Bitcoin bull runs:
2010-2011: The Genesis Rally
This initial surge, while small in absolute dollar terms, marked Bitcoin’s emergence. Starting from virtually zero, Bitcoin reached a peak of around $32 in June 2011. This rally was primarily driven by early adopters, cypherpunks, and individuals interested in the underlying technology. The news of Bitcoin being used on the dark web market Silk Road contributed to increased awareness, albeit with negative connotations for some. A subsequent crash followed, wiping out a significant portion of the gains, highlighting the inherent volatility of the nascent cryptocurrency.
2013: Two Peaks in One Year
2013 witnessed two distinct bull runs. The first propelled Bitcoin from around $13 in January to over $260 in April. This surge was fueled by increasing awareness and adoption in Europe, particularly in Cyprus due to the financial crisis there. The collapse of Mt. Gox, a major Bitcoin exchange at the time, triggered a sharp correction. However, Bitcoin rebounded later in the year, reaching a peak of over $1,100 in December. This second rally was driven by growing interest from Chinese investors and increasing mainstream media coverage.
2017: The ICO Boom and Mainstream Attention
2017 marked a significant shift, with Bitcoin breaking into the mainstream consciousness. Starting the year around $1,000, Bitcoin soared to nearly $20,000 by December. This massive rally was largely fueled by the Initial Coin Offering (ICO) boom, where numerous new cryptocurrencies raised funds by issuing tokens, often using Bitcoin or Ethereum. The narrative of Bitcoin as “digital gold” also gained traction, attracting institutional and retail investors alike. The hype surrounding blockchain technology also played a role. As with previous bull runs, this was followed by a substantial correction, often referred to as the “crypto winter.”
2020-2021: Institutional Adoption and Macroeconomic Factors
This bull run was arguably the most significant to date. Beginning in late 2020, Bitcoin surged from around $10,000 to a peak of nearly $69,000 in November 2021. This rally was driven by a confluence of factors, including increased institutional adoption from companies like MicroStrategy and Tesla, which added Bitcoin to their balance sheets. Macroeconomic factors, such as quantitative easing policies by central banks and concerns about inflation, further fueled the demand for Bitcoin as a potential hedge against fiat currency devaluation. The rise of decentralized finance (DeFi) and non-fungible tokens (NFTs) also contributed to the overall positive sentiment surrounding cryptocurrencies. Regulatory clarity, albeit slow and evolving, also provided some level of confidence to larger investors.
Future Bull Runs
Predicting future bull runs with certainty is impossible. However, factors such as increasing mainstream adoption, regulatory developments, technological advancements (like the Lightning Network), and macroeconomic trends are likely to play a role in any future price surges. The cyclical nature of Bitcoin’s price history suggests that periods of consolidation and correction are inevitable, but the underlying technology and increasing adoption provide a foundation for potential future growth.
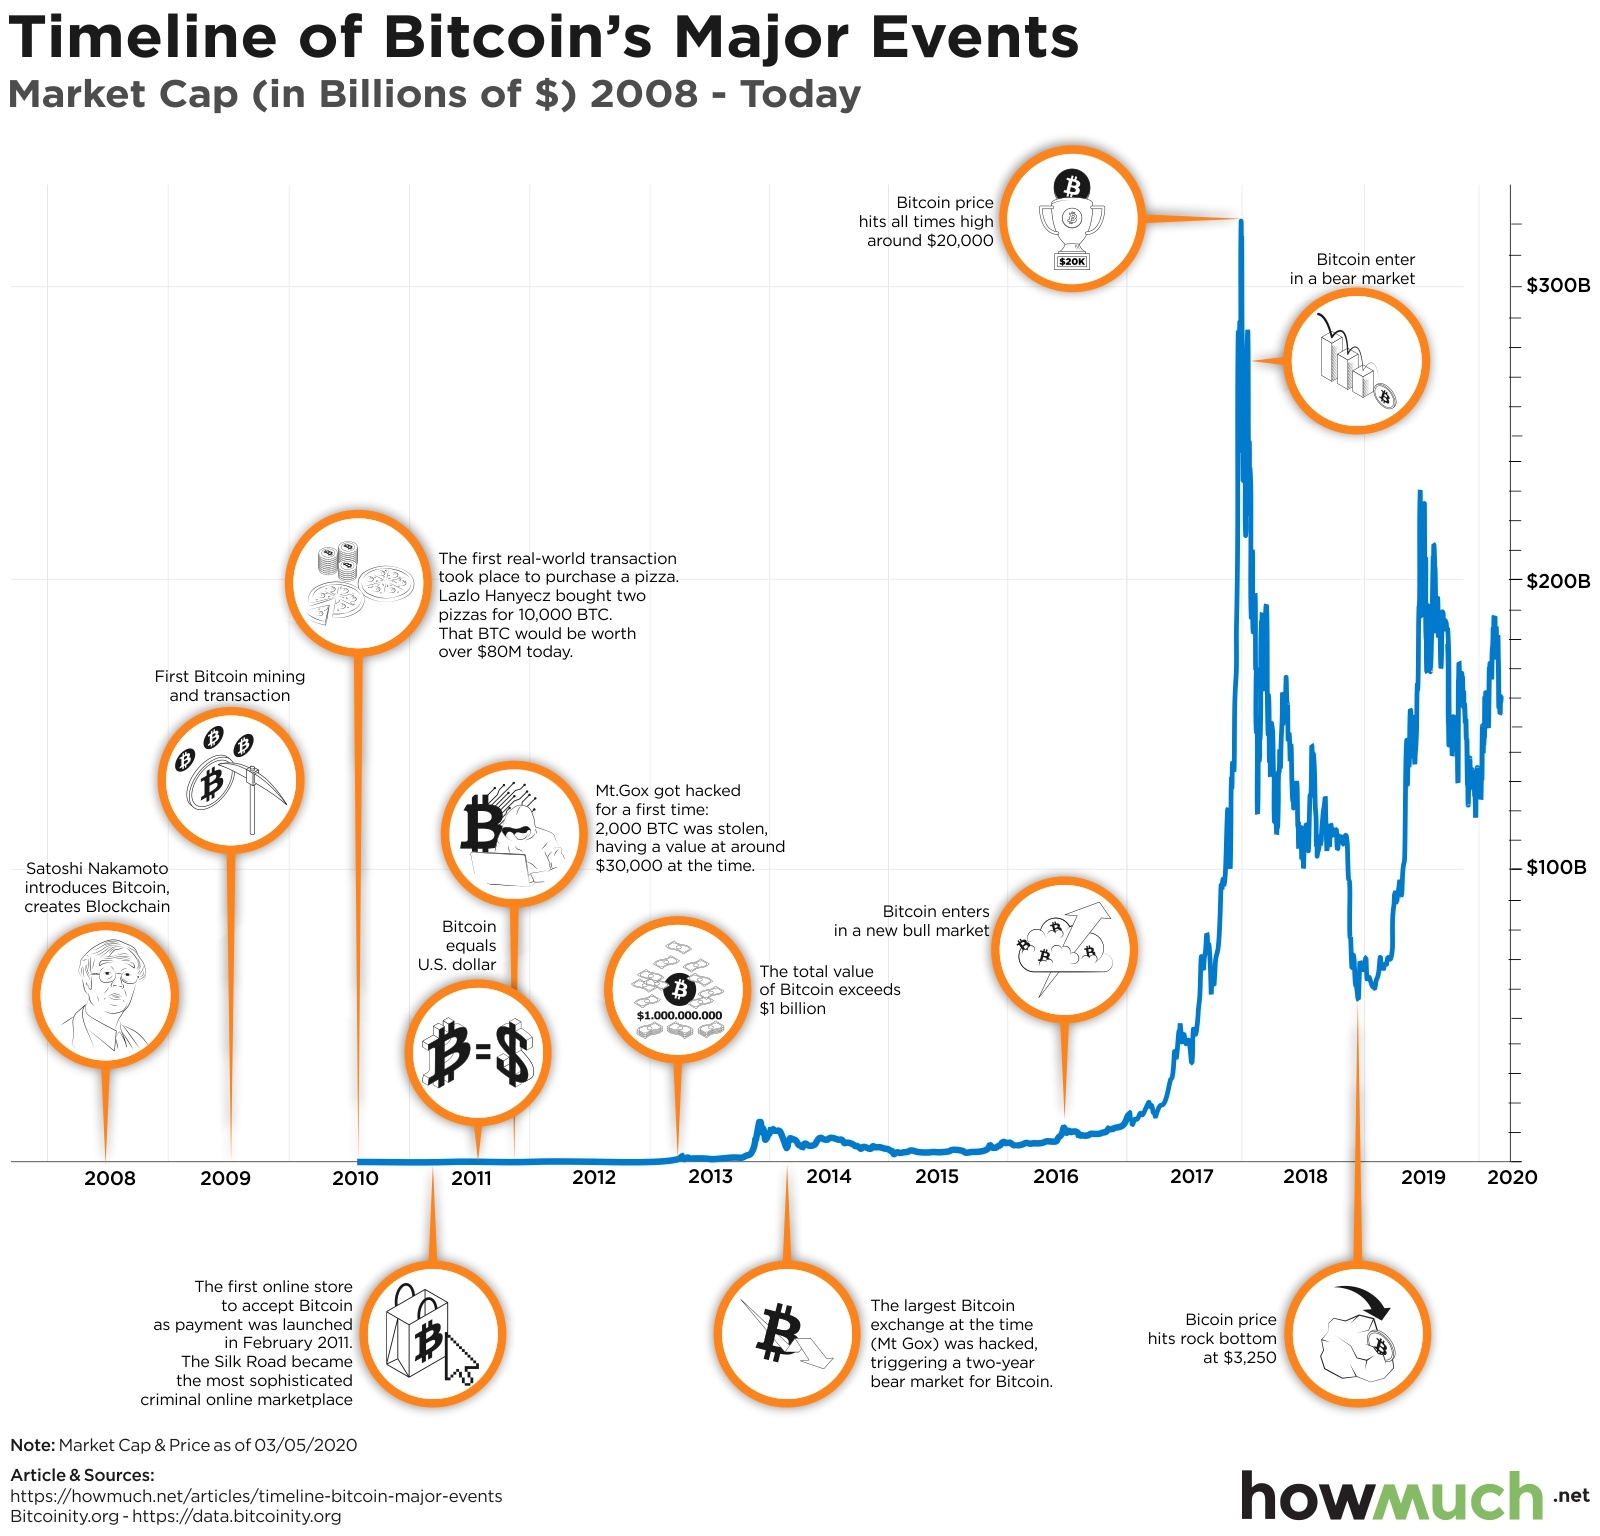 1600×1536 visualizing bitcoins wild ride decade from howmuch.net
  2662×1700 bull run bitcoin time from www.tradingview.com
  1200×628 beginning bitcoin bull run visual capitalist from www.visualcapitalist.com
  1472×888 history repeats bitcoin reach bull cycle from cryptopotato.com
  2868×1654 bitcoin bull run bear market weekly chart june bitstamp from www.tradingview.com