Bitcoin to Indonesian Rupiah (IDR) Chart Analysis
The Bitcoin to Indonesian Rupiah (BTC/IDR) chart reflects the dynamic exchange rate between the world’s leading cryptocurrency and Indonesia’s official currency. This chart is a crucial tool for investors, traders, and observers interested in the Indonesian cryptocurrency market. Its fluctuations are influenced by a complex interplay of global Bitcoin market trends and localized Indonesian economic and regulatory factors.
Key Drivers Influencing the BTC/IDR Chart
- Global Bitcoin Market Sentiment: The overall global sentiment towards Bitcoin heavily impacts the BTC/IDR rate. Positive news regarding institutional adoption, technological advancements, or regulatory clarity often drives up global Bitcoin prices, which subsequently increases the BTC/IDR value. Conversely, negative news such as regulatory crackdowns, security breaches, or macroeconomic uncertainties can lead to price declines.
- Indonesian Economic Factors: The strength of the Indonesian Rupiah plays a significant role. A weakening Rupiah against the US Dollar often translates to a higher BTC/IDR rate, as more Rupiah are required to purchase the same amount of Bitcoin. Inflation rates, interest rate decisions by Bank Indonesia (the central bank), and overall economic growth influence the Rupiah’s valuation and therefore indirectly affect the BTC/IDR chart.
- Indonesian Regulatory Landscape: Indonesia’s stance on cryptocurrencies is evolving. Initial restrictions have given way to a more nuanced approach, allowing for regulated trading under specific conditions. Government policies, tax regulations, and legal frameworks surrounding Bitcoin and other cryptocurrencies directly impact investor confidence and market activity, ultimately affecting the BTC/IDR chart. Any regulatory ambiguity or restrictive measures can dampen enthusiasm and lead to price drops.
- Local Demand and Adoption: The level of Bitcoin adoption and demand within Indonesia is a significant factor. Increased adoption by individuals, businesses, and financial institutions drives up demand, which can push the BTC/IDR price higher. Factors influencing local demand include ease of access to Bitcoin exchanges, awareness and education about cryptocurrencies, and the perceived benefits of Bitcoin as an investment or payment method.
- Trading Volume and Liquidity: The trading volume on Indonesian cryptocurrency exchanges and the overall liquidity of the BTC/IDR pair affect price stability and volatility. Higher trading volumes typically lead to more efficient price discovery and reduced price swings. Lower liquidity can exacerbate price fluctuations, making the market more susceptible to manipulation.
Analyzing the Chart: Key Indicators
Traders often use technical analysis tools on the BTC/IDR chart to identify potential entry and exit points. Common indicators include:
- Moving Averages: To identify trends and potential support/resistance levels.
- Relative Strength Index (RSI): To gauge overbought or oversold conditions.
- Moving Average Convergence Divergence (MACD): To identify momentum and potential trend reversals.
- Volume Analysis: To confirm price movements and identify strong buying or selling pressure.
Furthermore, examining historical price data and identifying key support and resistance levels can provide insights into potential price movements. It’s crucial to combine technical analysis with fundamental analysis, considering the broader economic and regulatory context within Indonesia.
Conclusion
The Bitcoin to Indonesian Rupiah (BTC/IDR) chart provides a valuable window into the interplay between global cryptocurrency trends and the Indonesian market. Understanding the key drivers that influence this chart, including global Bitcoin sentiment, Indonesian economic factors, the regulatory landscape, and local adoption rates, is essential for informed decision-making. Investors and traders should conduct thorough research and consider both technical and fundamental analysis before engaging in the BTC/IDR market.
 1280×639 indodax market signal december st from indodax.com
  640×360 analisa btcidr week bln agustus trading investing from tradeinvest.id
  1715×878 bitcoin indonesia stqidr chart published coinigycom st from www.coinigy.com
  1219×533 mengenal bitcoin lebih from bsiteid.blogspot.com
  1200×630 bitcoin price btc idr converter chart news from www.binance.com
 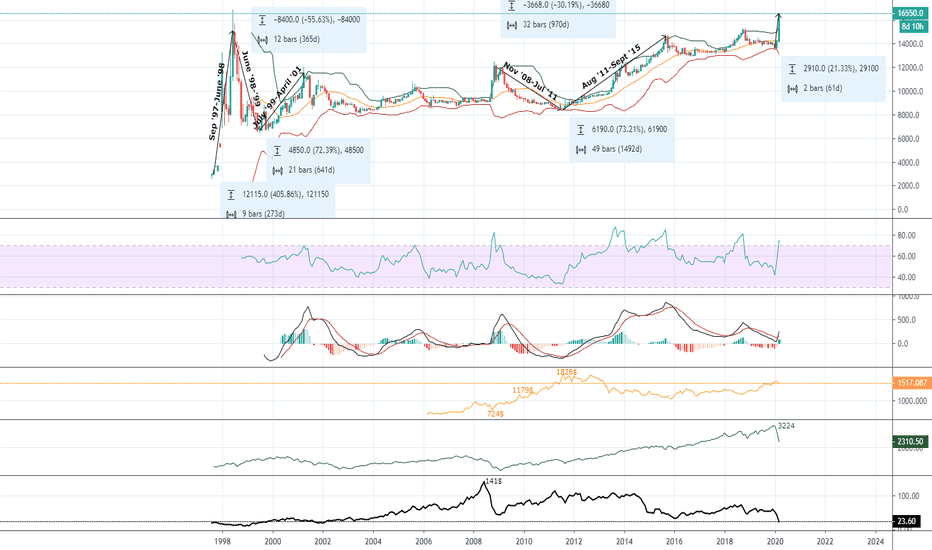 932×550 tradingview crypto idr koin crypto naik kasino bitcoin from vansromanandmusic.blogspot.com
 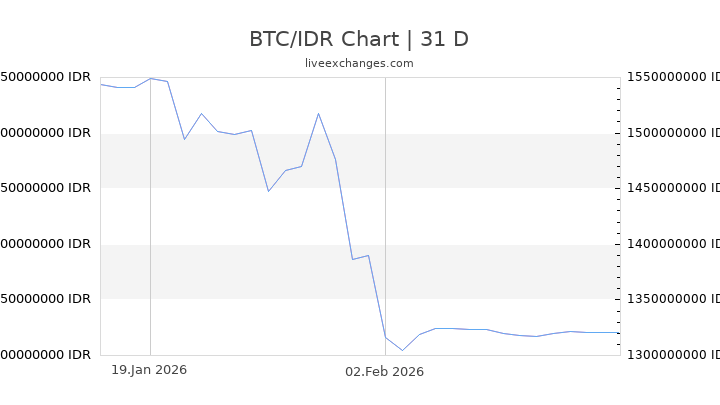 720×405 bitcoin rupiah from lydacoatox.blogspot.com
  1024×601 prediksi bernstein bitcoin capai rp miliar from news.tokocrypto.com
 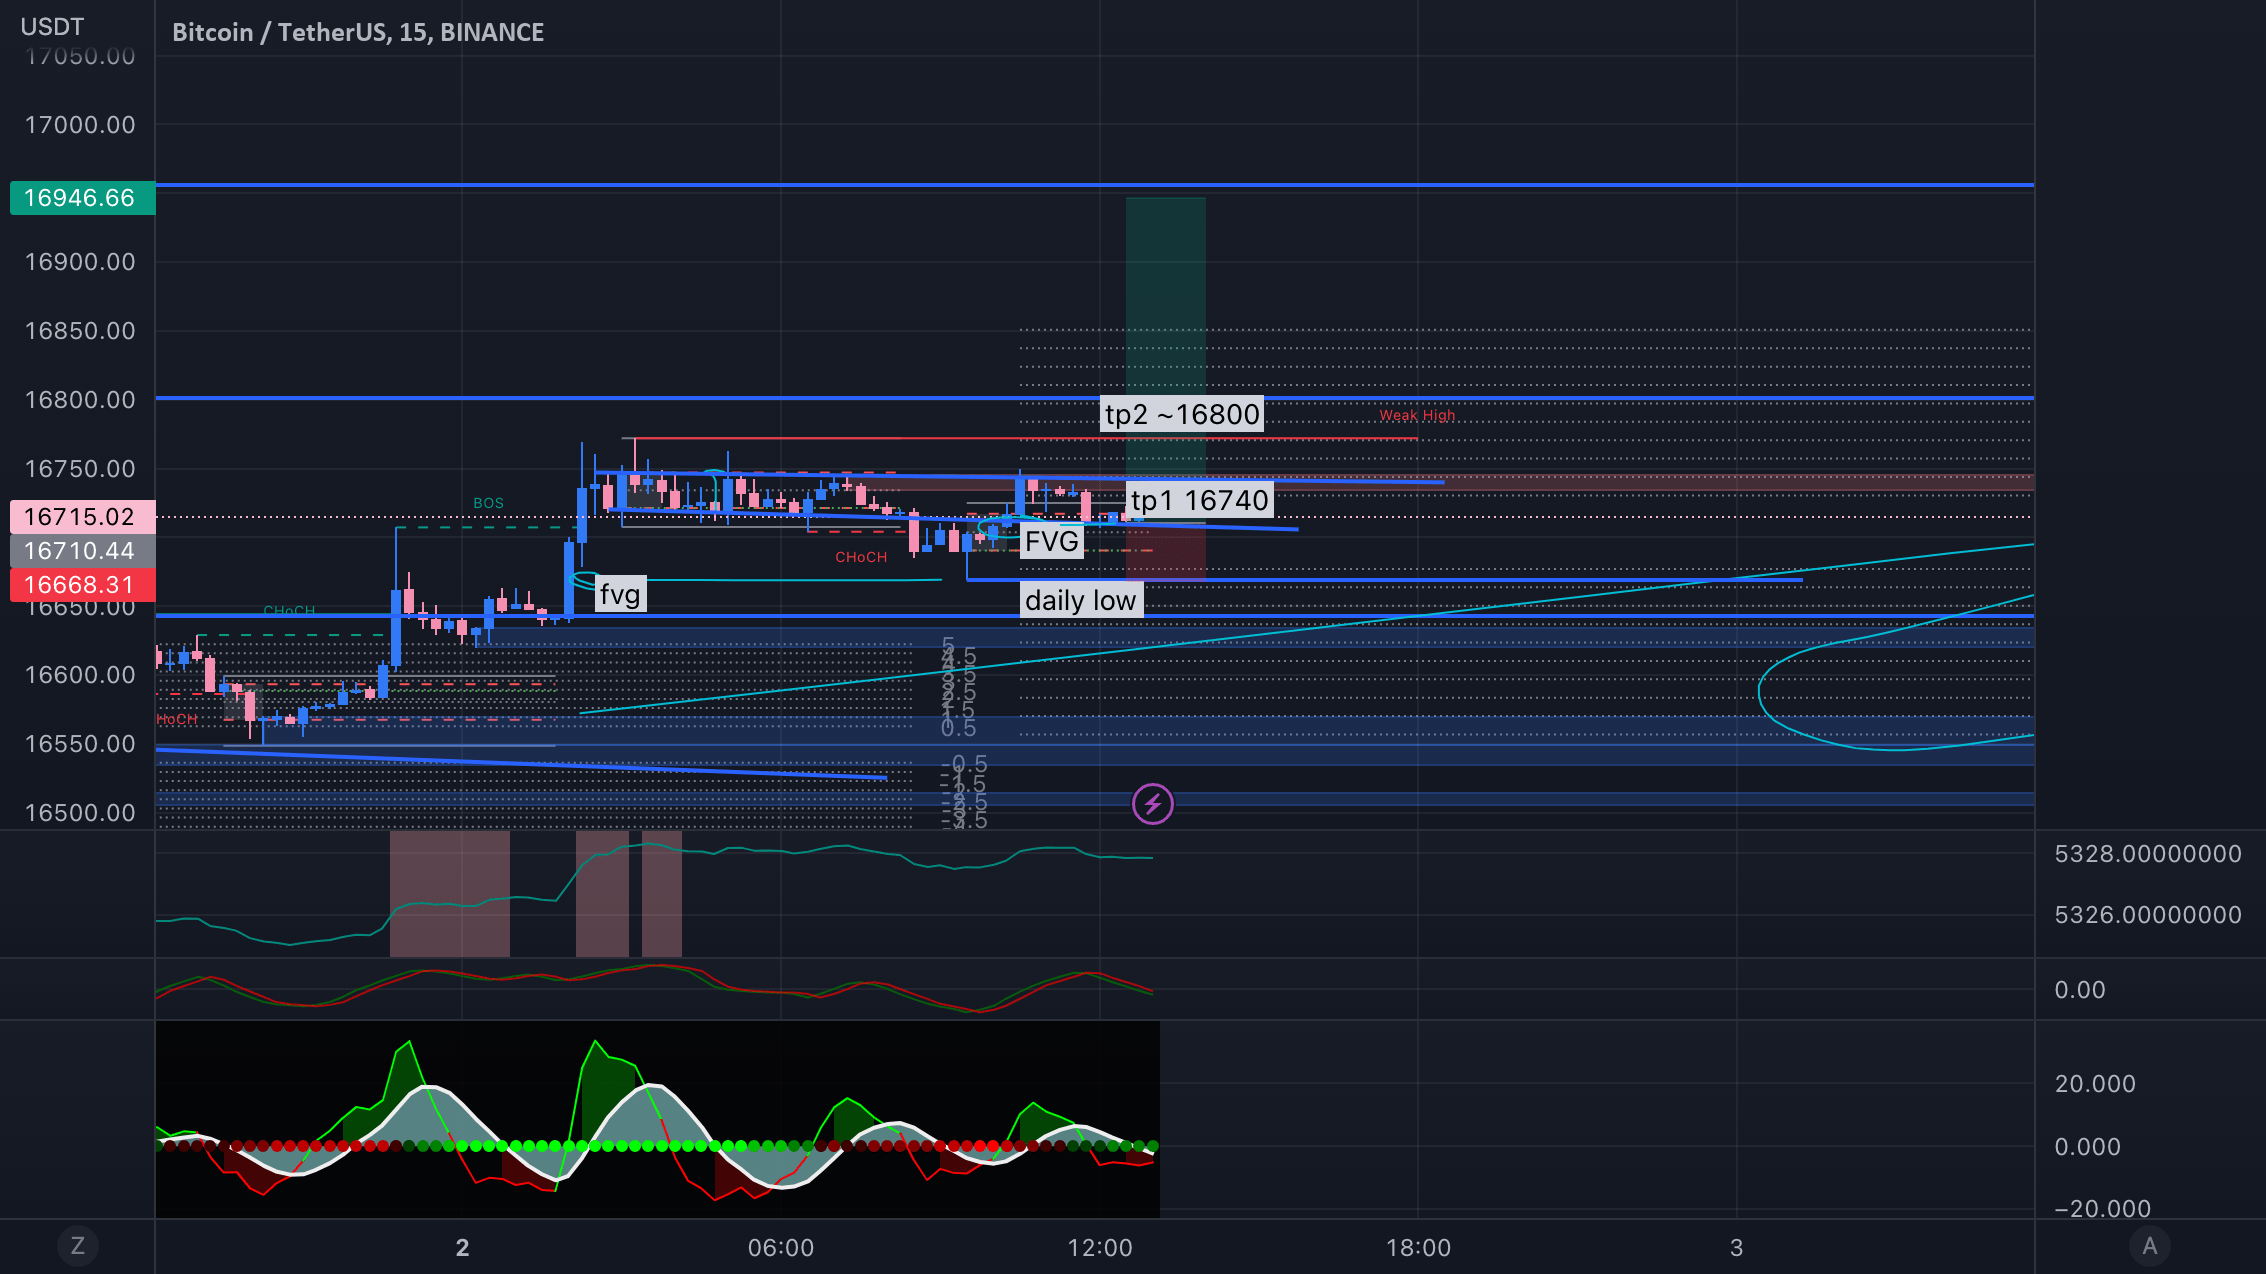 2266×1274 btc dridr experimental long binancebtcusdt decklyndubs from www.tradingview.com
 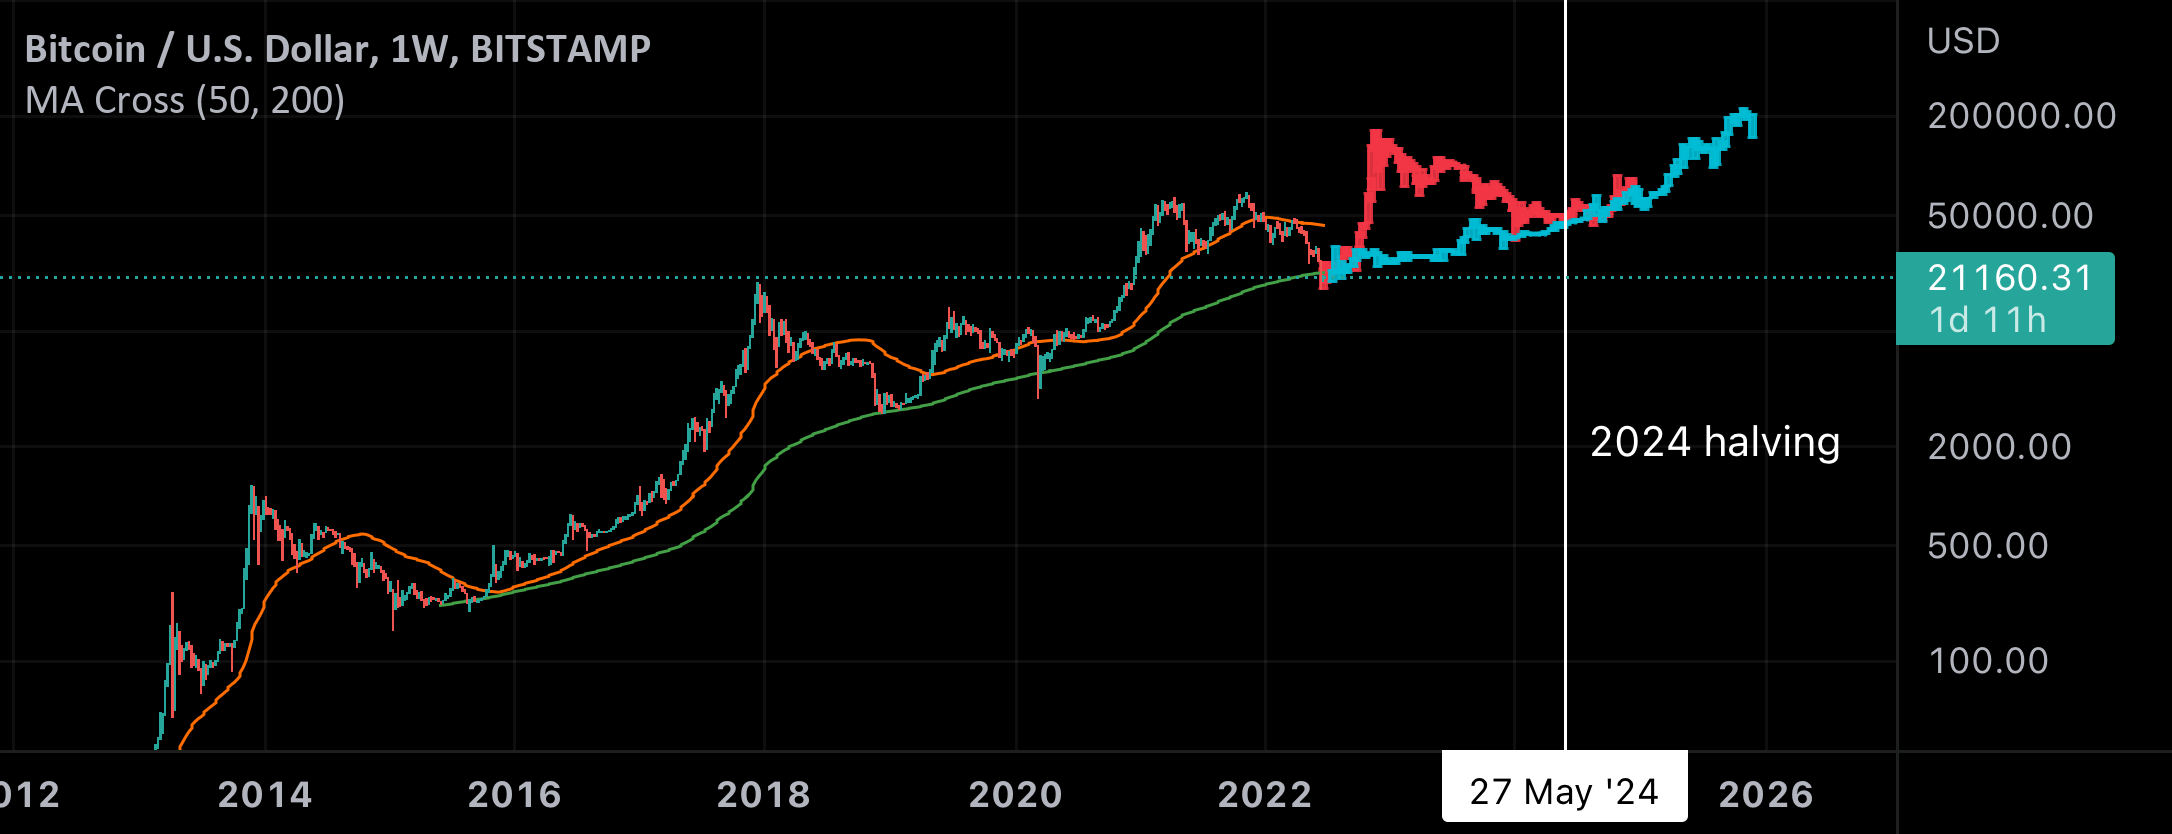 2172×834 bitcoin analysis bitstampbtcusd celebratecrypto from www.tradingview.com
  1280×720 bitcoin inr chart analysis jan youtube from www.youtube.com
  400×267 bitcoin chart rupiah idr editorial image cartoondealercom from cartoondealer.com
  507×288 btcinr chart bitcoininr graph chartoasiscom from www.chartoasis.com
  1200×630 bitcoin cash price bch price index chart idr converter from www.binance.com
  472×148 bitcoin inr chart chart bitcoin chart interactive charts from www.pinterest.com
  4396×3029 learn read bitcoin price charts from blokt.com
  1226×656 bullishe bitcoin charts die man einfach kennen muss from www.btc-echo.de
  1600×859 identify bitcoin bottom bikotrading academy from bikotrading.com
  1913×983 bitcoin chart analysis bulls return prices edge higher nasdaqcom from www.nasdaq.com
  2294×1107 bitcoin standard chart bitfinexbtcusd thecryptalpha from www.tradingview.com
  1378×720 crypto chart patterns explained read bitcoin charts from thebittimes.com
  768×514 technical border acts market from gettotext.com
  860×665 chart bitcoin price chart inr hd png transparent png from www.pngitem.com
  640×397 interesting bitcoin chart rbitcoin from www.reddit.com
 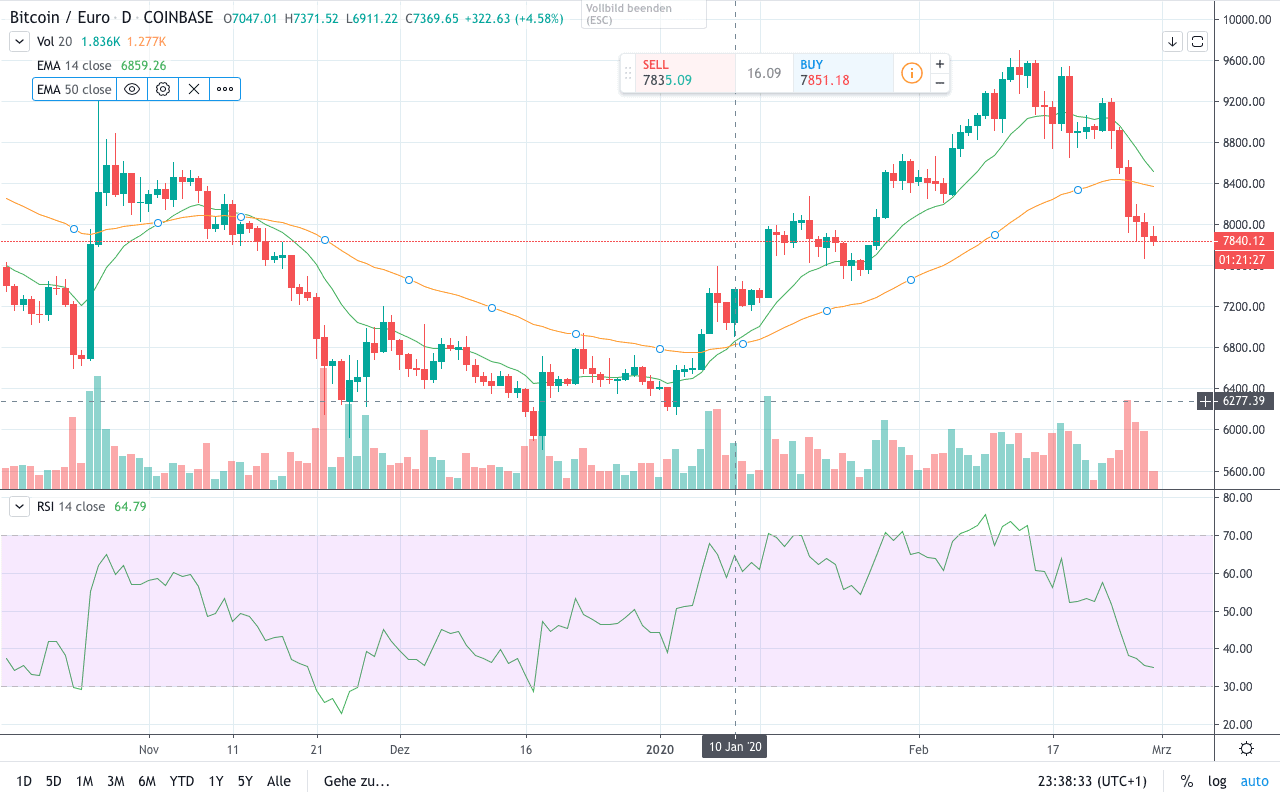 1280×800 die bitcoin chartanalyse diese indikatoren sollten anleger beachten from coin-ratgeber.de
  1920×1280 bitcoin trading chart plafonid from www.plafon.id
  370×250 bitcoin price history chart inr bitcoin price from l1andl2lang.blogspot.com
  1920×1280 bitcoin rainbow chart explained read from coinwire.com