The Bitcoin price graph, viewed across its entire lifespan, paints a volatile but ultimately upward-trending picture. From its obscure beginnings in 2009 to its present-day prominence, the journey has been marked by dramatic peaks, deep valleys, and periods of relative stability.
Initially, Bitcoin’s value was virtually non-existent. Trading was limited to enthusiasts, and the price remained below a dollar for well over a year. The first notable price surge occurred in 2011, briefly reaching $30 before crashing back down to around $2. This early volatility showcased the asset’s inherent risks but also hinted at its potential for rapid appreciation.
The following years saw a gradual increase in adoption and awareness. The 2013 bull run catapulted Bitcoin’s price above $1,000 for the first time. This milestone attracted mainstream attention, further fueling the rally. However, this boom was followed by a prolonged “crypto winter,” where prices languished for several years.
The narrative shifted again in 2017. Fueled by the ICO boom and growing institutional interest, Bitcoin experienced an exponential surge, reaching an all-time high of nearly $20,000. This parabolic rise captured the imagination of the public and cemented Bitcoin’s place in the financial lexicon. Again, the bubble burst, leading to another extended bear market that tested the resolve of many investors.
Despite these setbacks, Bitcoin has consistently demonstrated its resilience. Subsequent years saw a renewed interest, driven by factors such as institutional adoption, concerns about inflation, and its perceived role as a store of value. The 2020-2021 period witnessed another significant rally, surpassing the previous all-time high and pushing prices above $69,000. This cycle solidified the pattern of boom-and-bust that has defined Bitcoin’s history.
Analyzing the Bitcoin graph reveals several key characteristics. Firstly, volatility is a constant. Large price swings are common, making it a high-risk, high-reward asset. Secondly, Bitcoin exhibits cyclical behavior. Bull markets are often followed by bear markets, and vice versa. These cycles are influenced by a complex interplay of factors, including market sentiment, regulatory developments, and technological advancements.
Finally, the long-term trend remains positive. Despite numerous corrections and crashes, Bitcoin has consistently recovered and reached new highs. This suggests that, while not without risk, Bitcoin has the potential to continue appreciating in value over time. However, past performance is not indicative of future results, and investors should exercise caution and conduct thorough research before investing.
 1219×932 time bitcoin price chart from bitcoin.zorinaq.com
  2190×1274 complete bitcoin trading history indexbtcusd from www.tradingview.com
  1500×1000 bitcoin history chart price changed time sun from www.the-sun.com
  1300×740 bitcoin price history infographics prices chart from www.alamy.com
  1765×817 bitcoin time price chart logarithmic scale bitcoin from www.reddit.com
  626×282 chart day bitcoin history from nairametrics.com
  1596×898 historical bitcoin price trading education from trading-education.com
  1280×720 bitcoin rainbow chart explained maximize profits from marketrealist.com
 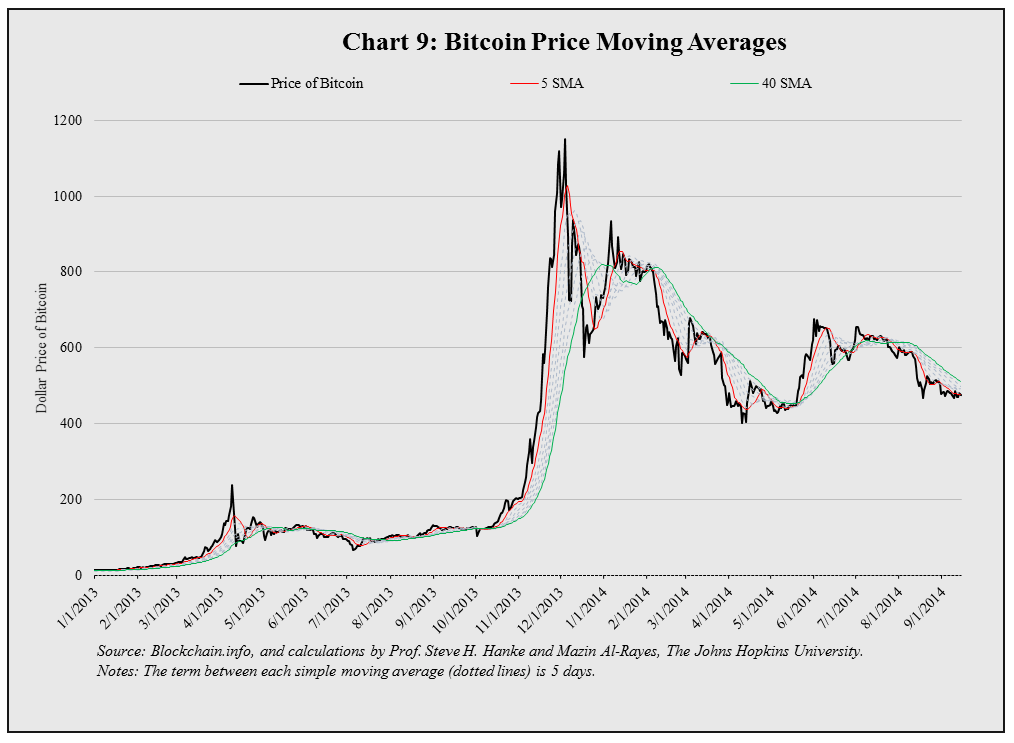 1014×743 bitcoin charts finally huffpost from www.huffingtonpost.com
  858×635 bitcoin charts spiral calendar from spiralcalendar.com
 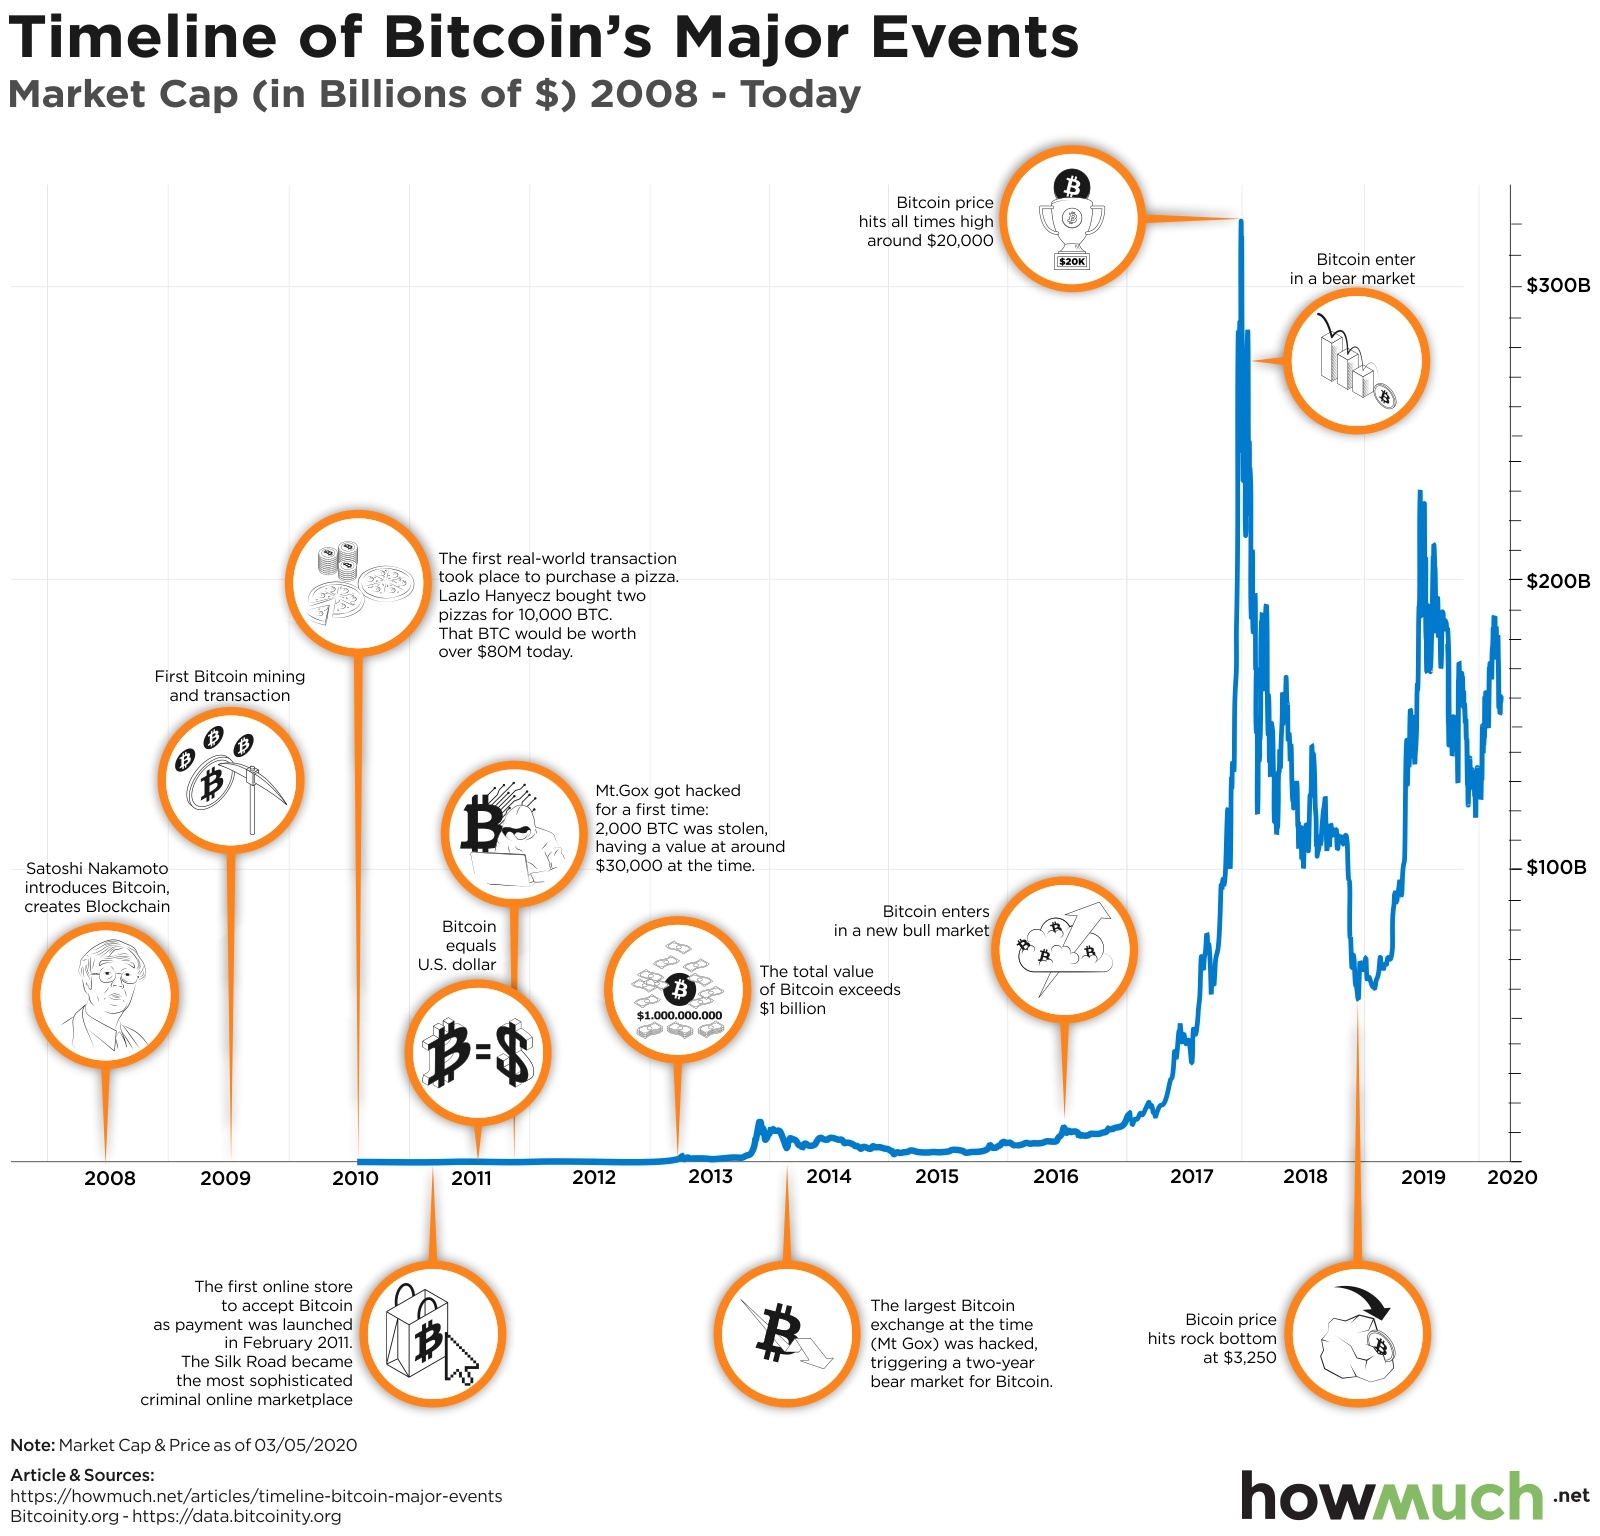 1600×1536 visualizing bitcoins wild ride decade from howmuch.net
  700×482 learn read bitcoin price charts from blokt.com
  1450×1221 bitcoin price time chart historical bitcoin price from cantikaa00009.blogspot.com
  1597×747 bitcoin price approaches time high record from www.dailyfx.com
  474×262 bitcoin chart inception june from www.brrcc.org
  1937×1135 breaking bitcoin price hits time high from www.fxstreet.com
  1280×720 bitcoin time price graph august october youtube from www.youtube.com
  1456×874 analysis current bitcoin bullish cycle from www.bitcoininsider.org
  562×309 bitcoin price history chart time historical data from bytwork.com
  3018×1710 bitcoin timeline history bitcoin timeline from lionmuthucomics.blogspot.com