Bitcoin’s price history is characterized by dramatic volatility and significant growth, making it a captivating subject for investors and observers alike. The earliest documented Bitcoin transactions in 2009 valued the cryptocurrency at virtually nothing. It was a novelty, primarily exchanged amongst cryptographers and early adopters. By 2010, the first real-world transaction occurred: 10,000 BTC were used to purchase two pizzas, effectively setting a price of less than a penny per Bitcoin. The first major price surge occurred in 2011, with Bitcoin reaching a brief high of around $30. This was fueled by increased media attention and a growing understanding of its decentralized nature. However, this boom was followed by a significant correction, with the price plummeting back down to around $2. This volatility became a recurring theme in Bitcoin’s history. 2013 marked another significant milestone. Fueled by the Cyprus banking crisis and growing interest from China, Bitcoin surged to over $1,000 for the first time. The enthusiasm was partly driven by the perceived safe-haven asset qualities of Bitcoin, as well as the potential for circumventing traditional financial controls. Again, this meteoric rise was followed by a sharp correction, lasting throughout much of 2014 and 2015. Contributing factors included the collapse of Mt. Gox, a major Bitcoin exchange, and regulatory uncertainty. The period between 2015 and 2017 saw a gradual but steady increase in price, culminating in the explosive bull run of 2017. Driven by mainstream media coverage, increased adoption by merchants, and the emergence of Initial Coin Offerings (ICOs), Bitcoin’s price skyrocketed to nearly $20,000 in December 2017. This peak attracted a massive influx of retail investors, driven by fear of missing out (FOMO). As with previous surges, the 2017 bull run was followed by a prolonged bear market known as the “crypto winter.” Throughout 2018, Bitcoin’s price steadily declined, bottoming out around $3,000 in late 2018/early 2019. This period saw a cooling of enthusiasm and a re-evaluation of the underlying technology and its potential. From 2019 onward, Bitcoin began a slow recovery. The narrative shifted from pure speculation to a focus on Bitcoin as a store of value and a hedge against inflation. Institutional investors started to show increased interest, and companies like MicroStrategy and Tesla began adding Bitcoin to their balance sheets. 2020 and 2021 witnessed another major bull run, with Bitcoin reaching an all-time high of over $69,000 in November 2021. This surge was fueled by a combination of factors, including quantitative easing by central banks, increased adoption by institutional investors, and the growing popularity of decentralized finance (DeFi). Following the 2021 peak, Bitcoin’s price experienced another significant correction throughout 2022, influenced by rising interest rates, macroeconomic uncertainty, and the collapse of several major crypto firms. As of late 2023/early 2024, Bitcoin has shown signs of recovery, driven by anticipation of upcoming halving events and continued institutional interest. Bitcoin’s price history is a rollercoaster ride marked by periods of explosive growth and sharp corrections. While its future remains uncertain, its resilience and evolving narrative continue to fascinate and attract attention within the financial world. Understanding its past volatility is crucial for anyone considering investing in this volatile asset.
 1000×780 bitcoin price history infographics vector image from www.vectorstock.com
  1920×1781 bitcoin soars rally means investors from www.dw.com
 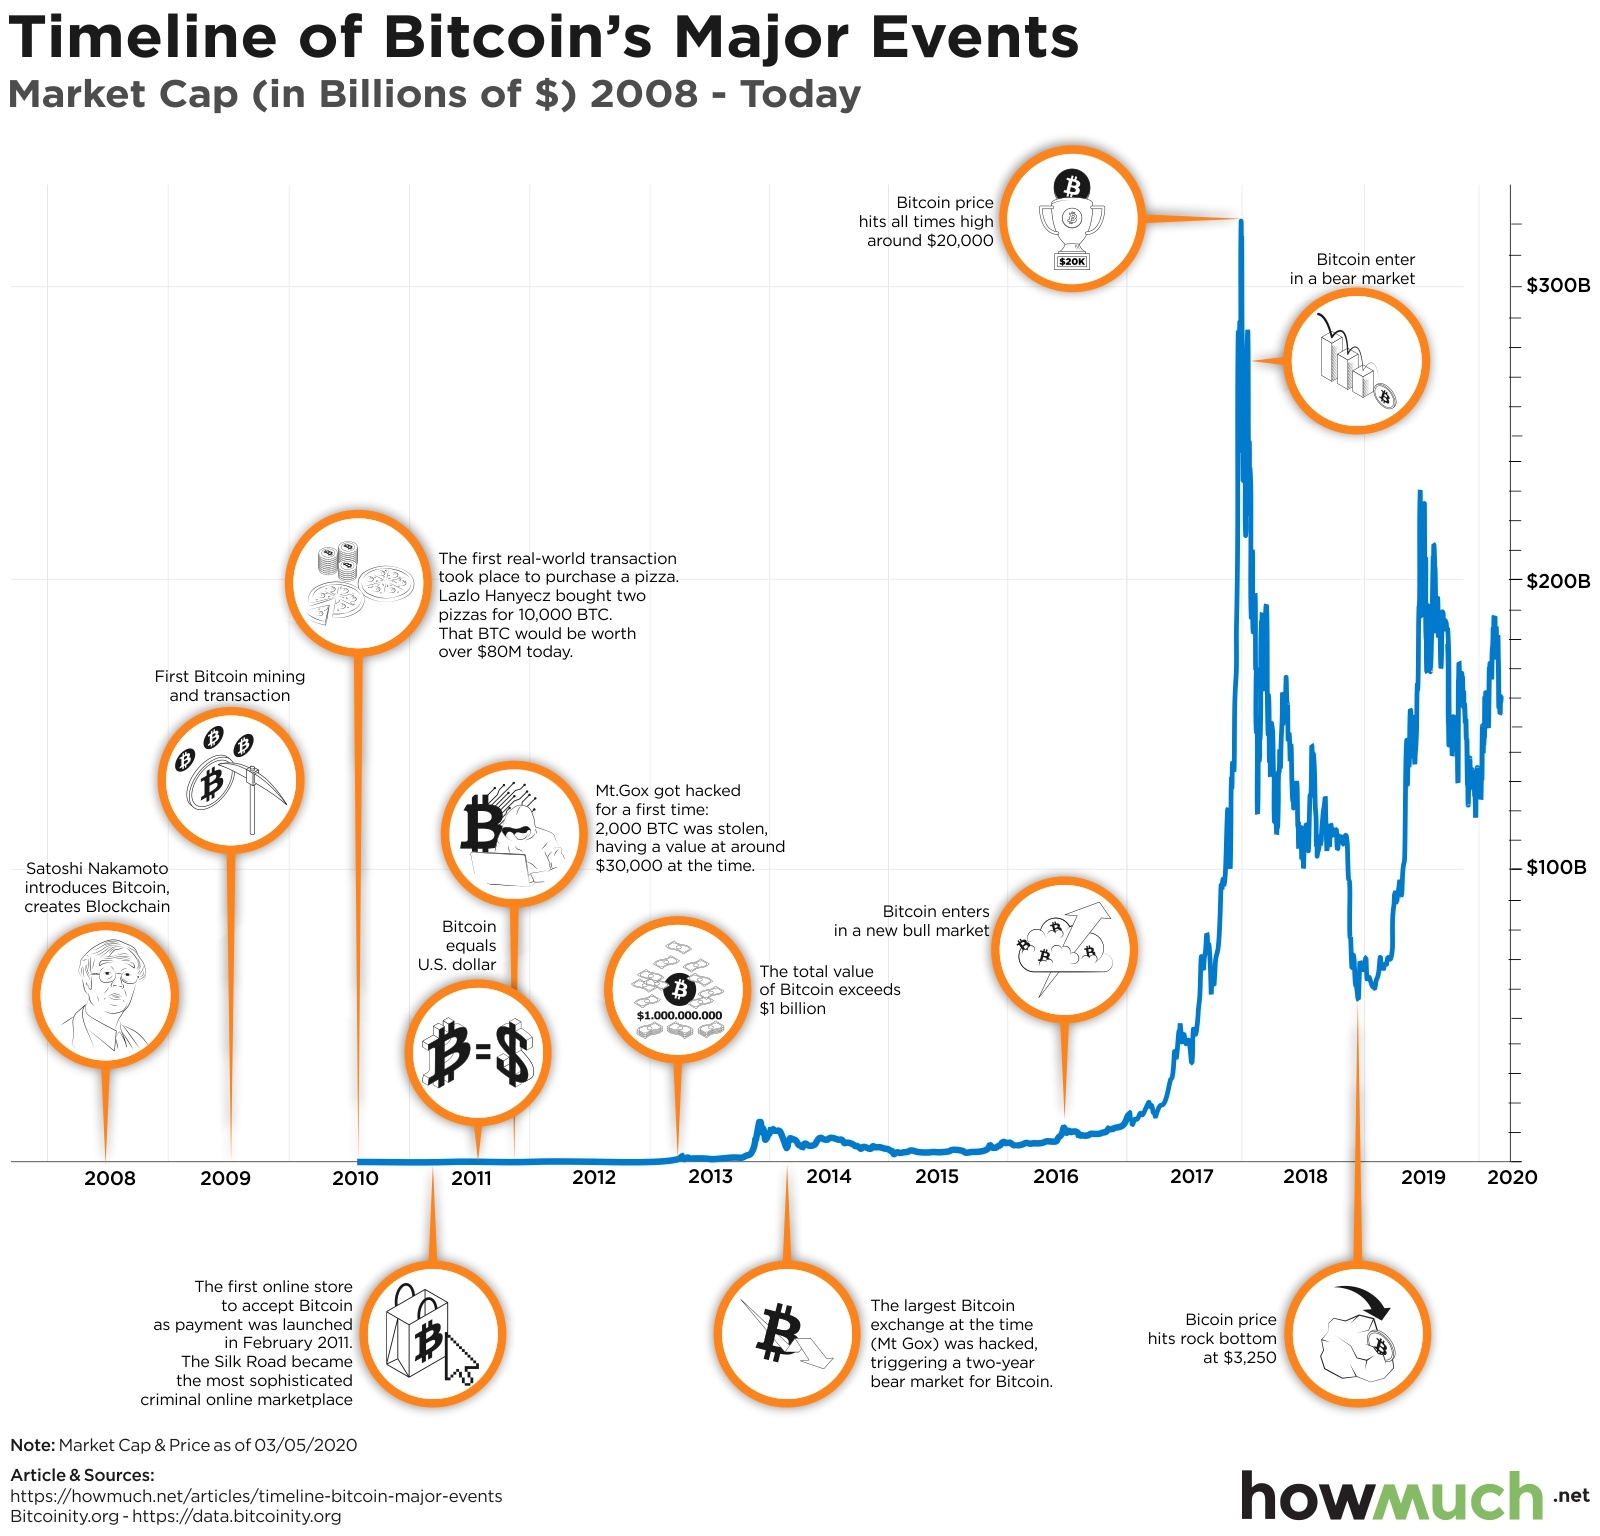 1600×1536 visualizing bitcoins wild ride decade from howmuch.net
 :max_bytes(150000):strip_icc()/chart-a1180b0256bb4878a73237582b6509de.jpeg) 800×550 bitcoins price history from www.investopedia.com
800×550 bitcoins price history from www.investopedia.com  1300×740 bitcoin price history infographics prices chart from www.alamy.com
  900×600 bitcoin price history chart yearcharts from www.5yearcharts.com
  1200×842 chart annotated history bitcoin business insider from www.businessinsider.com