The Relative Strength Index (RSI) is a momentum oscillator used in technical analysis to assess the speed and change of price movements. When applied to Bitcoin (BTC), the RSI can provide insights into potential overbought or oversold conditions, helping traders and investors make more informed decisions.
The RSI is calculated using the following formula: RSI = 100 - (100 / (1 + RS)) where RS is the average gain of up periods during the specified time frame divided by the average loss of down periods during the same period. The standard time frame is 14 periods, often days when analyzing daily charts. A shorter period, like 9, makes the RSI more sensitive to price fluctuations, while a longer period, like 25, smooths out the RSI and makes it less reactive.
The resulting RSI value ranges from 0 to 100. Generally, an RSI above 70 suggests that Bitcoin is overbought, implying that it might be due for a price correction or consolidation. Conversely, an RSI below 30 suggests that Bitcoin is oversold, indicating that it might be poised for a price rebound. It’s important to remember these are just general guidelines, and interpretations can vary depending on market conditions and an individual’s risk tolerance.
Using the RSI effectively with Bitcoin involves more than just observing overbought and oversold levels. Traders often look for divergences between the RSI and the price action. For example, if Bitcoin is making higher highs, but the RSI is making lower highs, this is a bearish divergence, potentially signaling a weakening uptrend and a possible upcoming price decline. Conversely, if Bitcoin is making lower lows, but the RSI is making higher lows, this is a bullish divergence, suggesting a weakening downtrend and a potential price increase.
Another useful strategy is identifying RSI support and resistance levels. Similar to price charts, the RSI itself can exhibit support and resistance areas. Breakouts or breakdowns of these RSI levels can provide confirmation signals for potential trades. For instance, if the RSI consistently bounces off a level around 40, that level could act as a support area. A break below 40 might signal further downside.
It is critical to avoid relying solely on the RSI as a standalone indicator. It is best used in conjunction with other technical analysis tools and indicators, such as moving averages, Fibonacci retracements, and volume analysis. Additionally, consider the fundamental factors influencing Bitcoin, such as regulatory news, adoption rates, and technological advancements. The volatile nature of the cryptocurrency market makes it prone to sudden price swings, so combining technical and fundamental analysis is essential for making sound investment decisions. The RSI is a valuable tool in the Bitcoin trader’s arsenal, but it must be used thoughtfully and strategically.
 1024×567 find bitcoins relative strength index rsi from www.sylvainsaurel.com
 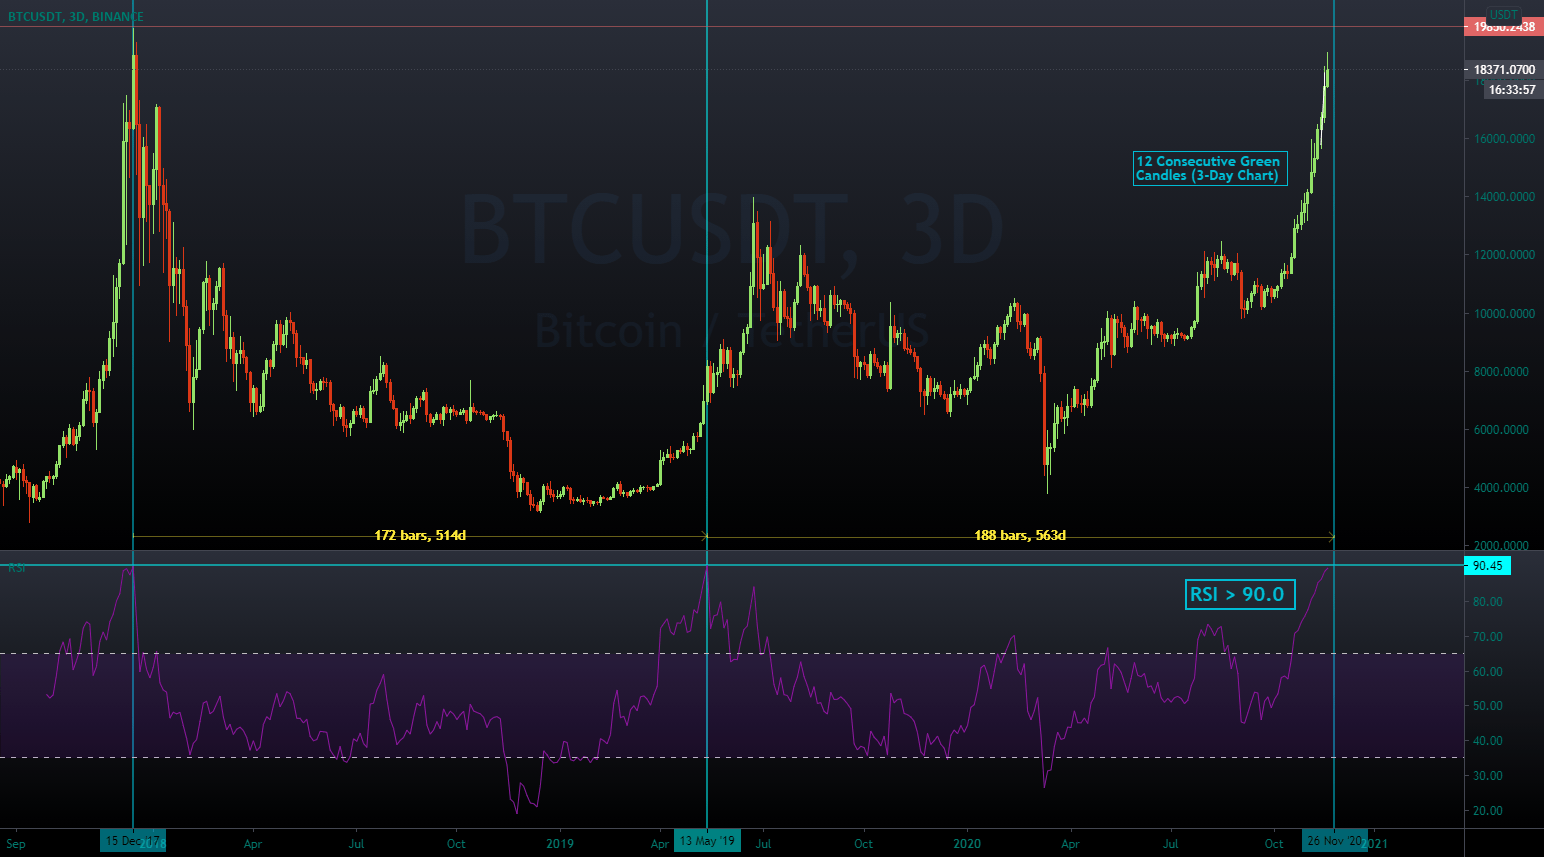 1544×857 bitcoin rsi day chart binancebtcusdt from www.tradingview.com
 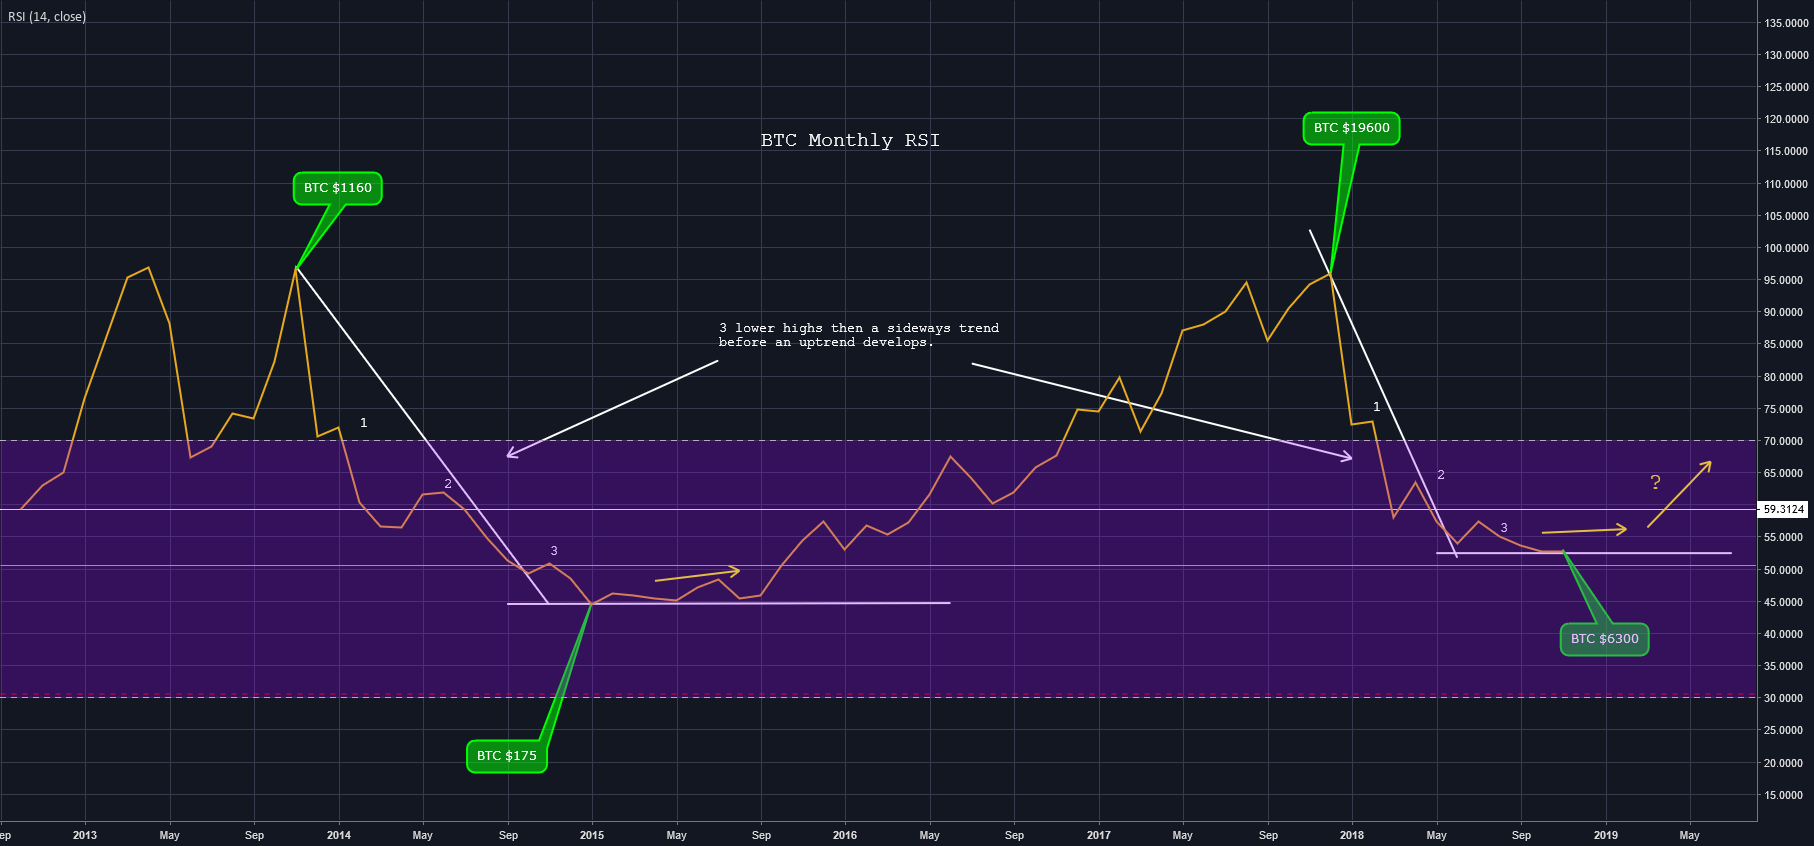 1814×846 bitcoin monthly rsi chart bitstampbtcusd marius tradingview from www.tradingview.com
  1050×709 bitcoin rsi pattern suggests market cycle begun beincrypto from beincrypto.com
 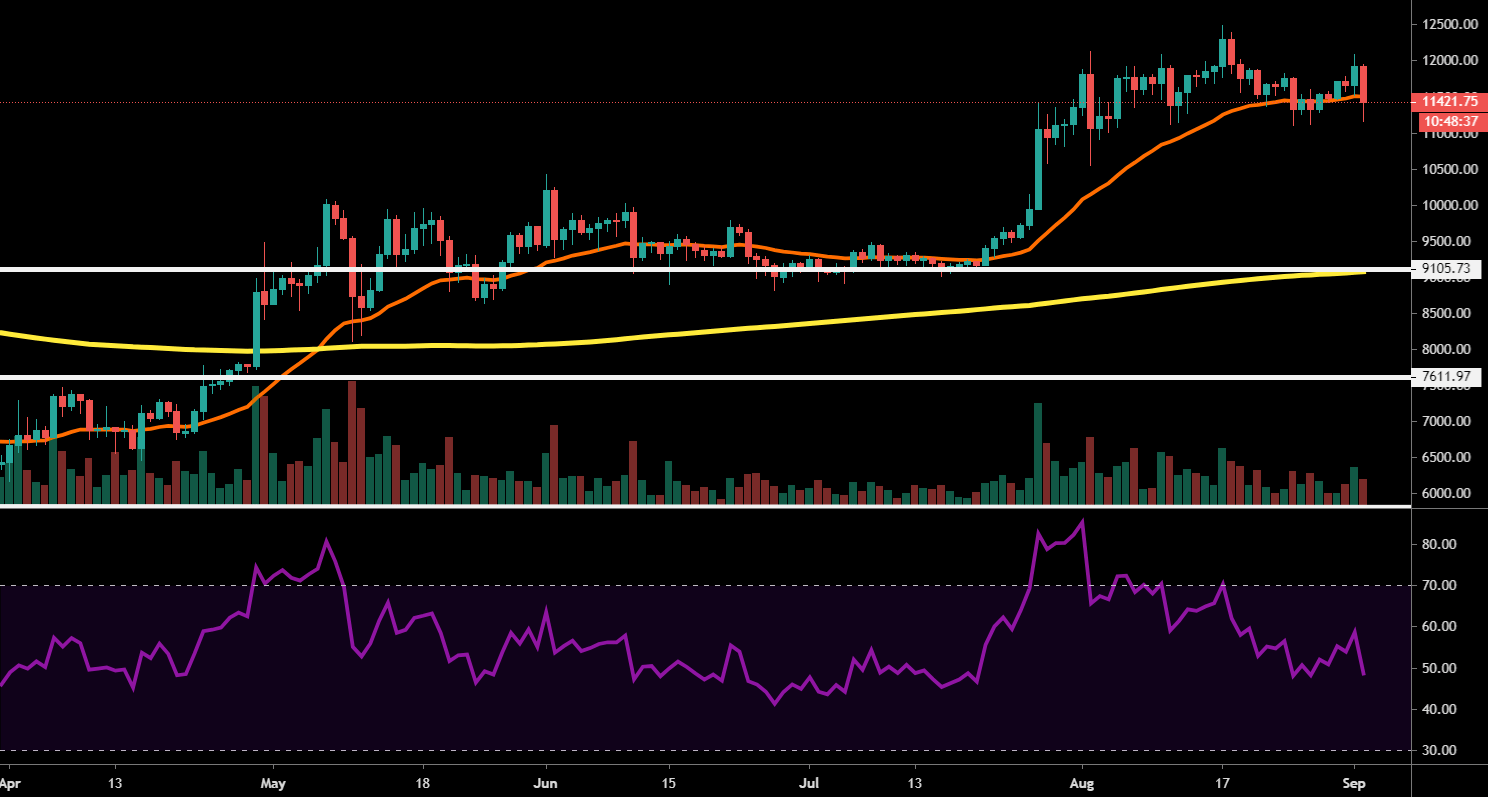 1488×797 bitcoin rsi coinbasebtcusd crypto tradingview from www.tradingview.com
  1280×720 bitcoin trend relative strength index rsi cycle youtube from www.youtube.com
  0 x 0 bitcoin daily rsi breakout youtube from www.youtube.com
  1024×683 rsi indicator bitcoinik from bitcoinik.com
Leave a Reply