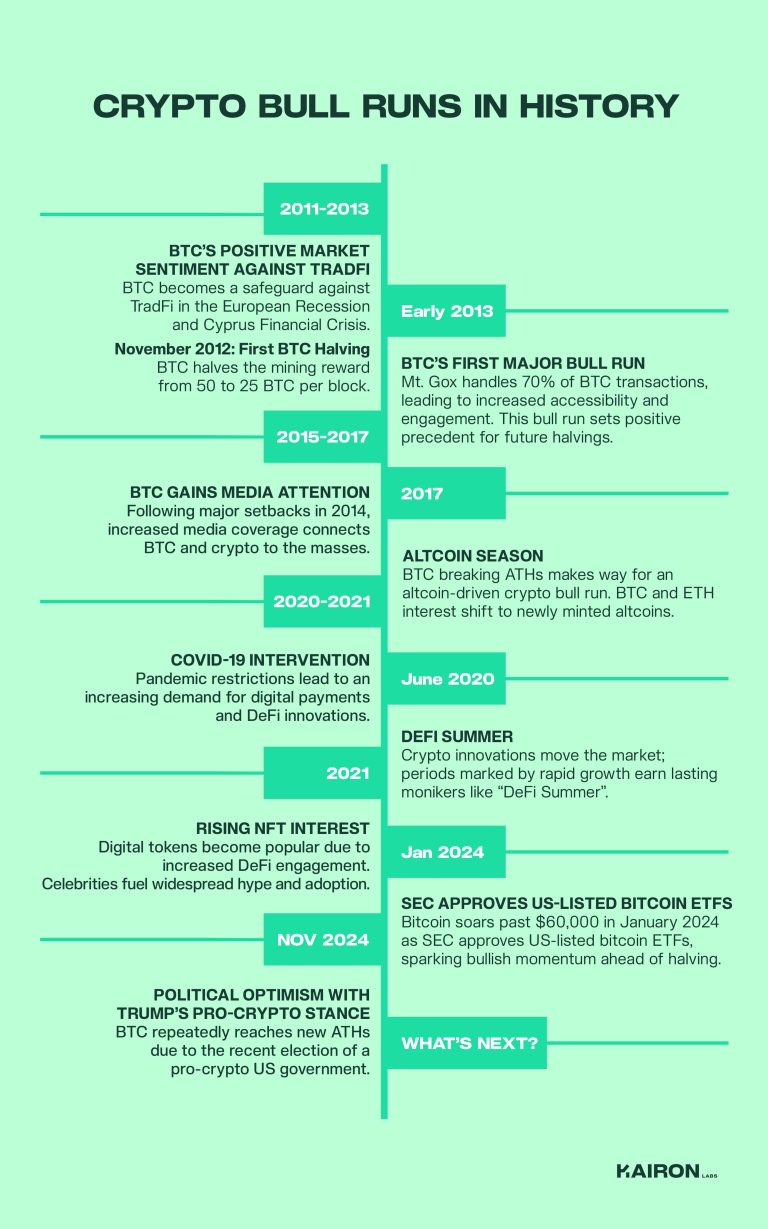
Grafico Bull Run Bitcoin
A “bull run” in the context of Bitcoin refers to a sustained period of significant price increases. Observing a Bitcoin price chart, or “gráfico” in some languages, during a bull run is a unique and often exhilarating experience for investors. These periods are characterized by rapid appreciation, heightened market sentiment, and widespread media attention. Understanding the key characteristics of a Bitcoin bull run chart can provide valuable insights, although it’s important to remember that past performance is not indicative of future results.
Key Characteristics of a Bitcoin Bull Run Gráfico:
- Steep Upward Trend: The most obvious feature is a consistently climbing price. The chart displays a near-vertical trajectory as Bitcoin’s value surges over days, weeks, or months. The steepness of the incline is a key indicator of the intensity of the bull run.
- Higher Highs and Higher Lows: Even within the overall upward trend, there are fluctuations. However, in a true bull run, each subsequent peak (high) surpasses the previous peak, and each dip (low) remains higher than the previous dip. This pattern confirms the strong underlying bullish momentum.
- Increased Trading Volume: Bull runs are typically accompanied by a significant increase in trading volume. As more people become aware of and excited about Bitcoin’s rising price, they rush to buy, pushing the volume higher. This increased volume acts as fuel for the rally, validating the price movement.
- Exponential Growth: Bull runs often exhibit exponential growth, meaning the price increase becomes more pronounced as time goes on. The chart might start with a gradual incline, but as the bull run progresses, the curve becomes steeper and steeper, reflecting an accelerating rate of appreciation.
- Breakouts and Resistance Levels: The chart will show Bitcoin consistently breaking through previous resistance levels. Resistance levels are price points where selling pressure is expected to increase, potentially halting the upward trend. In a bull run, these levels are easily overcome, demonstrating the strong buying pressure.
- Fibonacci Retracement Levels: Traders often use Fibonacci retracement levels to identify potential support and resistance areas. During a bull run, the price often respects these levels, pausing briefly before continuing its upward trajectory.
- Positive Sentiment Indicators: While not directly on the price chart, sentiment indicators often correlate with a bull run chart. Tools like the Fear & Greed Index will show extreme greed, reflecting the overwhelming positive sentiment driving the market.
Interpreting the Gráfico:** Analyzing a Bitcoin bull run gráfico involves looking at more than just the price. Consider the trading volume, the speed of the ascent, and the broader market context. Is the rally driven by genuine adoption, institutional investment, or speculative hype? Understanding the underlying factors is crucial for making informed decisions.
Cautionary Note: While observing a bull run chart can be exciting, it’s essential to remember that these periods are often followed by significant corrections. What goes up must come down. Entering the market during the late stages of a bull run can be risky. Always conduct thorough research, understand your risk tolerance, and avoid FOMO (Fear of Missing Out). No gráfico can predict the future with certainty, and responsible investing is paramount.
 2868×1654 bitcoin bull run bear market weekly chart june bitstamp from www.tradingview.com
 2662×1700 bull run bitcoin time from www.tradingview.com
 1470×856 historical data bull run btc ltc peak from www.reddit.com
 474×201 bull run historic data bitcoin suggests from www.tradingview.com
 474×340 bitcoin halving bull run cycle from medium.com
 474×328 bitcoin historic chart suggests bull run starting from cryptopotato.com
 885×804 top traders bitcoin log chart points style btc bull run from cointelegraph.com
 1200×664 redenen waarom deze bitcoin bull run anders from nieuws.btcdirect.eu