Bitcoin Bull Run 2021 Chart
The Bitcoin bull run of 2021 was a dramatic and widely discussed event, characterized by a significant price surge and increased mainstream adoption. Examining the chart of this period provides insights into its key phases, drivers, and potential pitfalls.
The upward trend began in late 2020, fueled by institutional interest, particularly from companies like MicroStrategy and Tesla, who announced significant Bitcoin investments. This validation from established players helped to legitimize Bitcoin in the eyes of many investors, signaling a shift from a purely retail-driven market to one with substantial institutional backing. The chart reflects this initial surge, showing a steady climb from around $10,000 in October 2020 to over $40,000 by January 2021. This period was marked by increasing media coverage and a growing sense of FOMO (Fear of Missing Out) amongst retail investors.
Following this initial ascent, the chart reveals a period of consolidation and correction. While the overall trend remained bullish, there were several pullbacks, where the price dropped significantly before recovering. These dips often coincided with negative news events, such as regulatory concerns or profit-taking by early investors. However, each correction was followed by a higher high, indicating strong underlying demand and investor confidence. The market seemed resilient, bouncing back from these temporary setbacks.
The peak of the bull run occurred in April 2021, when Bitcoin reached its then-all-time high of nearly $65,000. This period was characterized by widespread euphoria and increased media hype. The chart shows an almost parabolic ascent, driven by a combination of factors, including continued institutional interest, increased retail participation, and the rise of decentralized finance (DeFi) and non-fungible tokens (NFTs), which further fueled interest in the cryptocurrency space. Elon Musk’s tweets, both positive and negative, also had a noticeable impact on the price, contributing to both the upward and downward volatility.
However, the euphoria was short-lived. From May 2021 onward, the chart shows a sharp and significant correction. Several factors contributed to this downturn, including concerns about the environmental impact of Bitcoin mining, regulatory crackdowns in China, and Musk’s announcement that Tesla would no longer accept Bitcoin as payment due to environmental concerns. These events triggered a wave of selling pressure, leading to a substantial price decline. The chart reflects this dramatic drop, with Bitcoin plummeting to below $30,000. This correction served as a reminder of the inherent volatility and risk associated with cryptocurrency investments.
Despite the significant correction, the bull run was not entirely over. The chart shows a period of consolidation followed by another attempt to reach new highs in the fall of 2021. Bitcoin briefly reached a new all-time high of around $69,000 in November 2021 before experiencing another correction. This final push was driven by renewed institutional interest and growing acceptance of Bitcoin as a store of value. However, this proved to be a final hurrah, as the market entered a prolonged bear market in 2022. The 2021 Bitcoin bull run chart provides a valuable case study in market cycles, highlighting the importance of understanding market sentiment, risk management, and the impact of both macroeconomic factors and influential figures on cryptocurrency prices.
 2868×1654 bitcoin bull run bear market weekly chart june bitstamp from www.tradingview.com
 1917×896 bitcoin tendency differences today from elitecurrensea.com
 1613×888 btc bull run march binancebtcusdt xavierlopez from www.tradingview.com
 474×201 bull run historic data bitcoin suggests from www.tradingview.com
 2560×1441 top bitcoins bull run planb from cryptopotato.com
 740×428 analysis bitcoins bull run top expected january from cryptopotato.com
 1472×888 crypto bull run date cryptocurrency bull from wegogorasputin.blogspot.com
 2196×1301 crypto bull run date beginning bitcoin bull run from familiarochasc.blogspot.com
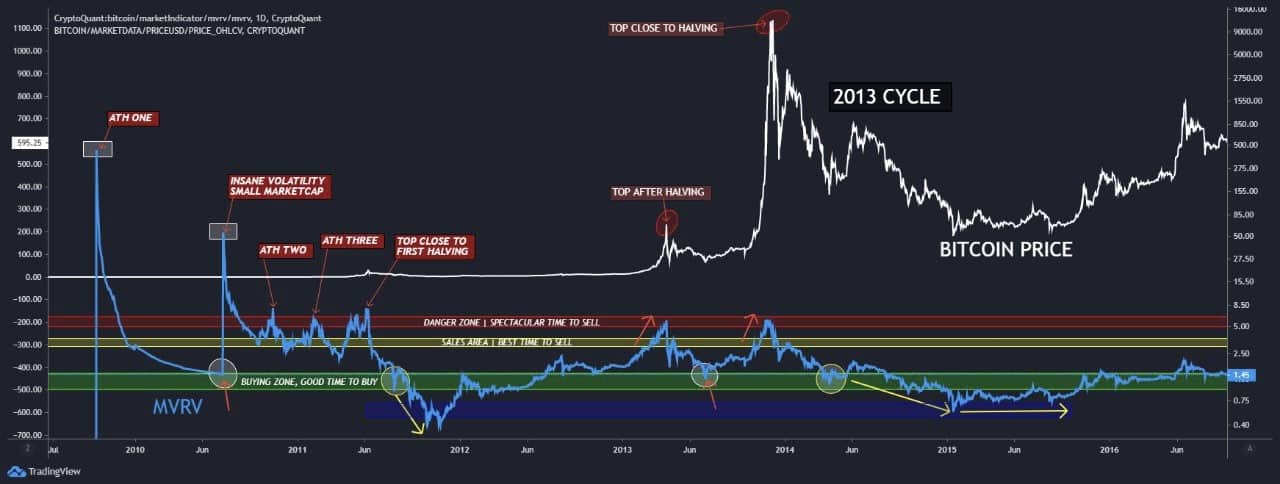 1280×484 analysis bitcoin undervalued bull run hasnt topped from cryptopotato.com
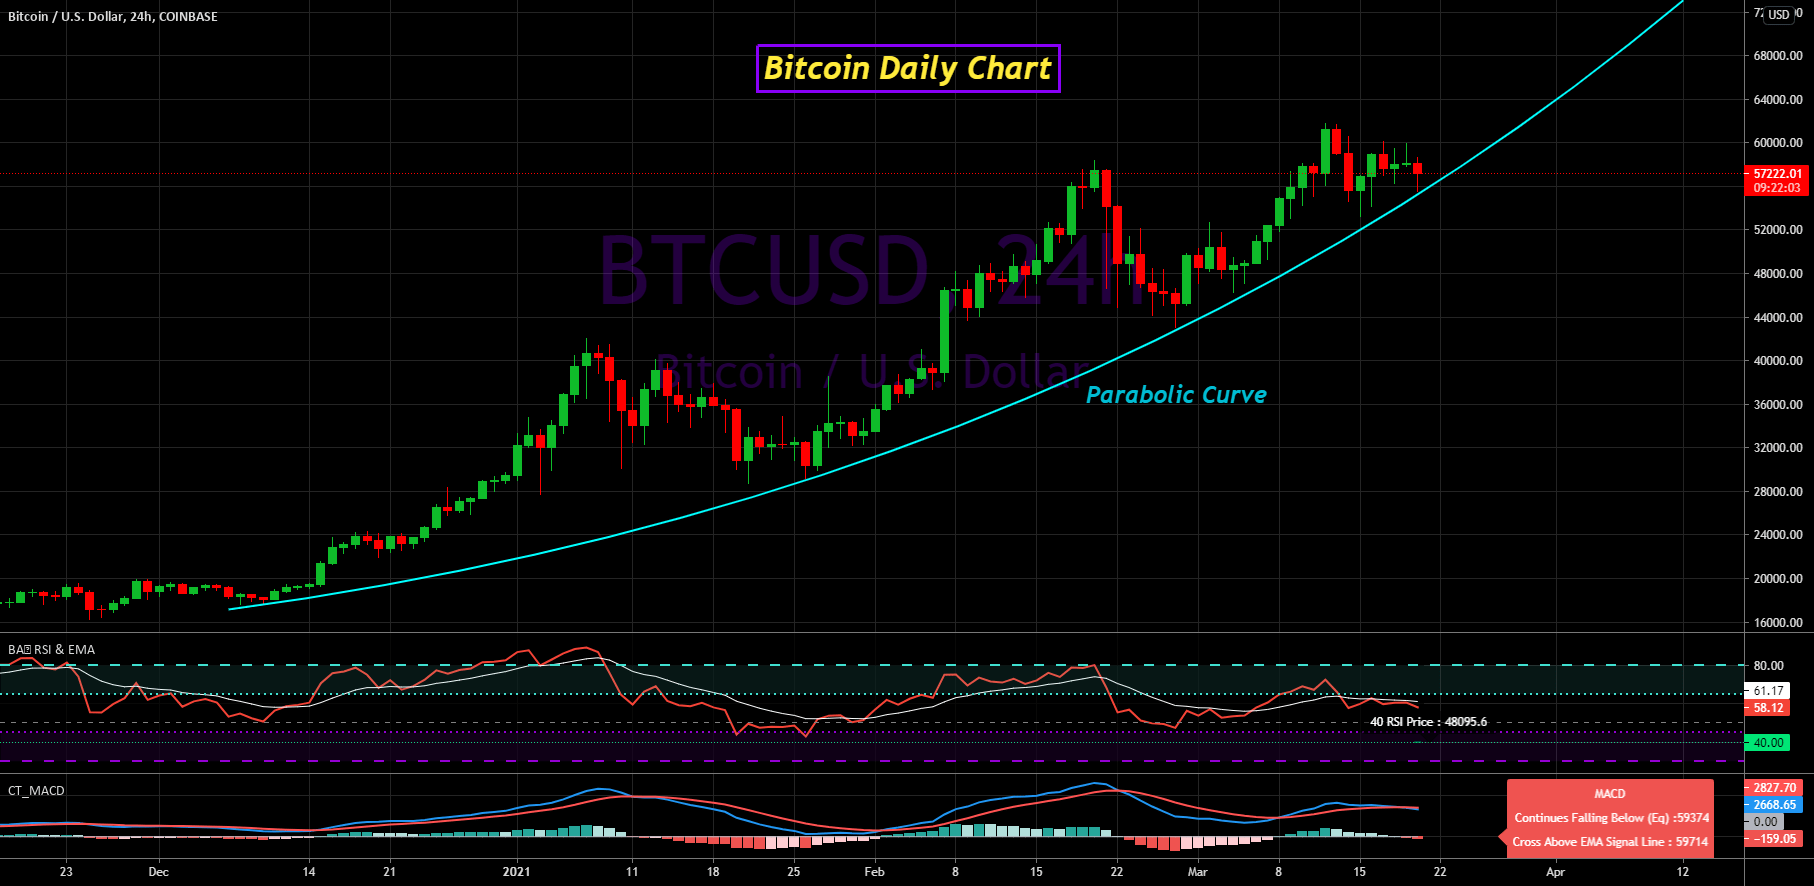 1814×886 bitcoin bull market parabolic curve coinbasebtcusd from www.tradingview.com
 1536×874 bitcoin bull run hiatus from blog.scopemarkets.com